Demography
Demography. What is Demography?. The study of human population Birth rate Death rate Immigration Emigration Population growth rate Natural increase Dependency load migration. On an average day in Canada there are…. 1050 births per day 690 deaths per day 769 immigrants per day


Demography
E N D
Presentation Transcript
What is Demography? • The study of human population • Birth rate • Death rate • Immigration • Emigration • Population growth rate • Natural increase • Dependency load • migration
On an average day in Canada there are…. 1050 births per day 690 deaths per day 769 immigrants per day 135 emigrants per day
So that means….. …. on an average day there will be 836 more people in Canada at the end of the day than there was at the beginning of it
Birth Rate • Number of births in a country per 1000 people. • Calculated by dividing the number of births in one year by the population and then multiplying the result by 1000. • BR = (# of births/population)*1000
Example Births = 390,000 Population = 30,000,000 BR = (390,000/30,000,000)*1000 = 13 births per 1000 people
Death Rate • Number of deaths in a country per 1000 people. • Calculated by dividing the number of deaths in one year by the population and then multiplying the result by 1000. • Death Rate = (# of deaths/population)*1000
Example Deaths = 120,000 Population = 30,000,000 DR = (120,000/30,000,000)*1000 = 4 deaths per 1000 people
Natural Increase Rate • Calculated using the birth and death rate. It is the most important reason why a country’s population changes, either increases or decreases. • Natural Increase Rate = (BR – DR)*100 (expressed as a percent)
Example BR = 13 per 1000 people DR = 4 per 1000 people Natural Increase Rate = (13/1000-4/1000)*100 • = 0.9%
Complete Natural Increase Rate section of the Demographics worksheet
Migration • the movement of people from one place to another
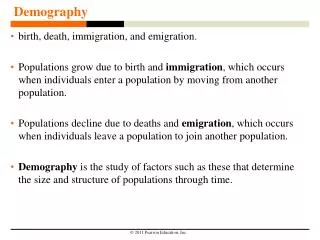
Types of Migration • Immigration- occurs when people arrive in a new place. • Emigration-occurs when people leave a place.
Net Migration • difference of immigrants and emigrants of an area in a period of time, divided per 1,000 inhabitants
Complete the Net Migration section on the Demographics Worksheet
Population Growth Rate • amountthat the population of a place is either increasing or decreasing over time.
Population Growth Rate • So for a country’s total growth rate we look at both Natural Increase and Net Migration. • Growth Rate= (Natural Increase Rate + Net Migration Rate)
Example Natural Increase Rate = 0.9% Net Migration Rate = 0.5% Growth Rate = 0.9% + 0.5% = 1.4%
Whether a country’s population is growing or declining has an enormous influence on the lives of the people. • If a country’s population is growing you must consider issues with providing enough housing, education, healthcare, employment, etc. • If a country’s population is declining there may be a shortage of workers and consumers to meet the needs of the country’s businesses.
Doubling Time • This tells us how long it will take for a country's current population to double. It is determined by dividing 70 by a country’s Growth Rate.
Example Population Growth Rate: 1.4% Doubling Time = 70 / 1.4 = 50 years
Total Fertility Rate Is the average number of children a woman is likely to have during her childbearing years. For a population to replace itself at a stable level this rate is 2.1
Dependency Ratio • The dependency ratio tells you how many economically inactive people (0-15 and 65+) are dependent upon the economically active population (16 to 64). • The equation above calculates a figure that shows the number of economically inactive people that are reliant on 100 economically active people.
Example A result such as 81.8 would mean that for every 100 economically active people there are 81.8 economically inactive people.