Download

1 / 9
100 likes | 231 Vues
This study delves into the branch of demography, exploring human population trends over time. Learn about population pyramids, growth rates, sustainability concerns, Malthusian theorems, exponential growth curves, and global demographic transitions. Analyze Europe's transition stages and China's demographic transitions from 2000 to 2050. Explore the impact of social factors on population dynamics and anticipate future scenarios based on demographic equations. Consider the balance of resources amidst population growth to shape sustainable social structures for the future.

E N D
Fall 2008 Soc 111 DEmography
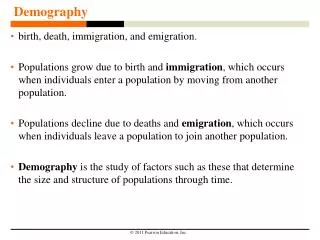
Demography • Branch that studies human population patterns and dynamics • Size of population, overall age structure, population distribution, and how the structure changes over time • Nearly all demographers are either trained as sociologists, economists, or statisticians
Population pyramids • Snapshot of a population • Depict a population by age and sex
Growth rate • Net change after fertility, mortality, and migration have been accounted for in a population • Basic demographic equation: Growth rate= births- deaths + net migration
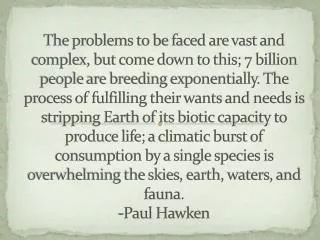
Sustainability is a modern concern • Thomas Malthus asked this in the 1790s • Potato increased food supply for lower classes • Population nearly doubled during 1700s • Malthus theorem • Populations grow geometrically (2 to 4 to 8…), but food supplies grow arithmetically (1 to 2 to 3…). • Are there enough resources? • Food, land, fossil fuels, housing units, schools, etc
Exponential growth curve due to increased nutrition and hygiene 8000 BC to 1750… 67,000 people/year ~Every 7 hours 6.7 billion Dec 2008 est Reached first billion in 1804 Adding a billion currently at a rate of about 12 years Outstripping not just food but other resources as well Europe’s transition is more realistic High death/ birth rates (Stage 1) High birth/low death rates (Stage 2) Low birth/death rates (Stage 3) Pop shrinkage: extremely low birth rates (Stage 4) World growth rate slowing Peak in 1963 of 2.2%/year Currently about half this New Malthusians vs. Anti-Malthusians
Prediction • How many social services/what social structures to put in place • Basic demographic equation cannot account for social factors • War, Famine, Economic depressions, Economic booms, Disease epidemics, even government policies
China’s demographic transition China, 2000 China, 2025 China, 2050