Download
1 / 1
10 likes | 166 Vues
Analysis of Various Types of Gasolines by Gas Chromatography/Mass Spectrometery Courtney Richardson, Shavelle Jenkins Department of Chemistry, University of West Georgia, Carrollton, Georgia. Abstract

E N D
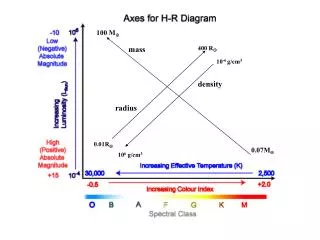
Analysis of Various Types of Gasolines by Gas Chromatography/Mass Spectrometery Courtney Richardson, Shavelle Jenkins Department of Chemistry, University of West Georgia, Carrollton, Georgia Abstract Three different octane levels of gasolines have been gathered from five different gas stations. In a previous experiment, their heat of combustion results have been determined. The goal of this project is to determine if there is any detectable similarities or patterns between these different types and suppliers of gasoline. Gas Chromatography accompanied by Mass Spectrometry is the method of choice because it allows the separation of the different chemicals of the gasoline in order to identify each one of them. The differences and patterns within the many gasolines from different octane rates and different gas stations have now been determined. Discussion Two total methods were used to determine which would produce clearer results. The first was method began running at a temperature of 70°C for two minutes then started to increase at a rate of 10°C per one minute for a total of thirty minutes equaling out at a final temperature of 300°C. This method was not the method of choice because it heated the components too quickly. The results did not show clear peaks over an interval of time but produced many overlaping peaks in a short time period. The next method began running at 50°C for twenty minutes then started to increase at a rate of 5°C per one minute for a total of sixty-four minutes of runtime and a final temperature of 250°C. This method seemed to work better than the previous one. The peaks were spread out over a longer period of time which made analysis and comparison quicker and easier. One particular element both of these methods had in common was the solvent delay employed at the beginning of each test. This delay lasted for approximately three minutes. When looking at the results in a graph, the peaks (which represent compounds) began at the very second the solvent delay was over. Since the peaks began so soon it was very possible that some components were being lost during the solvent delay period. The final method in which all the analysis were run did not use a solvent delay. • Results • This experiment did work correctly to the expectations of giving results. However the results that were given were not the results which were anticipated. Any results came out of the analysis’s but most were not in a particular pattern which was easy or even possible to trace. • Some of the components which were traceable pattern: • All regular grades of gasoline (87oct) had lots of small peaks (which were difficult for the GC/MS to determine) than Plus and Premium grades, which indicats the presence of impurities in this king of gasoline. • 1,3,5-tris(methylene)-Cycloheptane or one of its derivatives was present in at least one grade from every gas supplier but never in Regular grade. • Pentamethyl-Benzene was present in all grades of all gasolines except the Chevron Brand. • Phenly-propanal was only found in Walmart, BP, and Racetrac Regular grades of gasoline. • 3-Phenylbut-1-ene was only found in Racetrac, Cowboys, and Chevron Plus grades of gasoline. • 2-Pyrrolidione was only found in Walmart, Racetrac, and Cowboys Premium grades of gasoline. Introduction Gas prices are likely to continue rising through the summer and even on into the fall because of increased demand and tight supplies according to the United States Energy Information Agency. The government agency predicts that retail gasoline prices will average $3 a gallon this month (July 2007) and climb to $3.07 in August of 2007. Because of this inconsistent yet constantly increasing price of gasoline and the ever increasing demand for gasoline as personal vehicles (as the main mean of American transportation) as well as heating of homes and businesses, it seems interesting to analyze the three main grades of gasoline used during daily even hourly activities. This qualitative study, not quantitative, will allow us to understand the differences between the gasolines. For this particular experiment the samples of gasoline chosen to be analyzed are the three major octane levels 87, 89, and 93 from five different local gas stations: BP, Chevron, Cowboys, Racetrac, and Walmart.. Experimental set up Method: A Gas Chromatography/ Mass Spectrometry Machine (GC/MS) was the main machine used in this analysis. In order to use this machine a temperature method and a dilution ratio had to be determined first. These two prerequisite steps to the experiment can be done at the same time to some extent. Procedure for dilution: Since this particular data analysis has had never been recorded before, there was no advice as to determining the correct dilution quantities. Pure gasoline spectrum was very crowded with overlapping peaks, which indicated the need for dilution. Several dilutions were attempted, the final dilution which would work along with the method produced was 12.50 microliters (uL) of gasoline and 1487.50 uL of acetone. A total of 1.50 milliliters was used because the GC/MS sample vials are 1.50 milliliters. Temperature method: Different temperatures and rates of increased temperature over time had to be determined as to give the best possible results. Two different methods along with some variations were used before the desired results were given. Procedure for analysis: The samples tested were run overnight due to excellent time management, but to do so these samples had to be prepared just a few minutes prior to injection. Gasoline evaporates fairly quickly and with the small amount used evaporation would not take much time. Also because of this factor, only small bunches of tests could be run at one time. Before, after and between every analysis a “Burnoff” was required to be ran in order to keep well the GC column clean. Conclusion This study showed that different octane levels of gasoline as well as different suppliers contain components which are not common to all types. However few patterns were found; ones that were not particularly anticipated. More data need to be collected and analyzed in order to get the whole fingerprint of these gasolines and to be able to understand the differences between them from a qualitative point of view. Acknowledgements Dr. Anne Gaquere and Ms. Jill Stallings, University of West Georgia GEMS Research Program Administrators and Faculty members Faculty Research Grant, University of West Georgia National Science Foundation STEP grant #DUE-0336571 GC spectrum showing the good resolution between each peak. As shown in the above spectrum, the peaks begin around two minutes (time measured at the bottom of graph). The solvent delay of three minutes did not allow the results to be complete since the recording of components did not begin until after three minutes, thus indicating the need to rid of the solvent delay for our study.