Download
1 / 29
290 likes | 430 Vues
Last sixty years of mixed layer depth variability in the southern Bay of Biscay . Deepening of winter MLDs concurrent to generalized upper water warming trends?. R. Somavilla , C. González-Pola , M. Ruiz-Villarreal and A. Lavín. r aquel.somavilla@st.ieo.es.

E N D
Last sixtyyears of mixed layer depthvariability in the southernBay of Biscay. Deepening of winterMLDs concurrent to generalizedupper water warming trends? R. Somavilla, C. González-Pola, M. Ruiz-Villarreal and A. Lavín raquel.somavilla@st.ieo.es
LAST SIXTY YEARS OF MIXED LAYER DEPTH VARIABILITY IN THE SOUTHERN BAY OF BISCAY. DEEPENING OF WINTER MLDS CONCURRENT TO GENERALIZED UPPER WATER WARMING TRENDS? R. Somavilla, C. González-Pola, M. Ruiz-Villarreal and A. Lavín raquel.somavilla@st.ieo.es
LAST SIXTY YEARS OF MIXED LAYER DEPTH VARIABILITY IN THE SOUTHERN BAY OF BISCAY. DEEPENING OF WINTER MLDS CONCURRENT TO GENERALIZED UPPER WATER WARMING TRENDS? R. Somavilla, C. González-Pola, M. Ruiz-Villarreal and A. Lavín raquel.somavilla@st.ieo.es
Heat Storage Marine ecosystem and Global biogeochemical cycles Introduction Interannual √ Seasonal √ Daily √ Atmosphere … Long term variability? MLD Ocean Interior
In this work: Heat Storage Marine ecosystem and Global biogeochemical cycles Introduction Interannual √ Seasonal√ Daily√ … Long term variability? Atmosphere MLD Interannual, seasonal and decadal MLD variability in the southern Bay of Biscay. 1. Long term hydrographic time-series. 2.Upper ocean vertical structure climatology. 3. One dimensional water column model, GOTM model. Ocean Interior
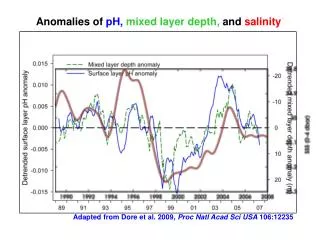
Introduction Warming in the Eastern North Atlantic Fact: Upper layers of the North Atlantic are warming. Long term warming trends Arbic& Owens (2001) 0.005ºC/yr [1920s to 1990s] Levitus et. at. (2005) 0.006ºC/yr [1955 to 2003] Potter & Lozier (2004) MW 0.010 ºC/yr [1955 to 2003] Recent strong warm anomalies Hollyday et. al (2008) UppT > 0.1ºC from 2000 Johnson & Gruber (2007) SPMW 0.7ºC 1993-2003 Thierry et. al (2008) SPWW 1.4ºC 1996-2003 González-Pola et al. ENACW and MW .0.30ºC 1994-2010
Waters Masses Variability from a MonthlyHydrographicalTimeseriesat the Bay of Biscay C. GonzálezPola, A.Lavín, R.Somavilla, C.Rodriguez and E.Prieto cesar.pola@gi.ieo.es
Introduction Spanish Institute of Oceanography (IEO) Santander ObservingSystem http://www.vaclan.es/ http://www.boya_agl.ieo.es/ http://www.seriestemporales-ieo.net/ Figure 1. Position of theVACLAN/COVACLAN projects sections (white dots); correntimeter moorings (black asterisk); the Santander standard section (black dots); and AGL buoy (red dot) in the Bay of Biscay and Eastern Atlantic margin
Introduction This presentation will examine: I. Results 1. MLD, upper waters and intermediate water mass variability 1994-2010. 2. Simulation MLD variability 1995-2008 using climatological profiles. Prevailingfactorsgoverning MLD variability Climatologicalprofilesskillsto reproduce MLD variability AIMS: Reconstructionpastevolution of MLD variability Table 1. Resume of theforcingsfields, data sets and time usedforrelaxationpurposes and periodscoveredbythedifferentsimulationscarriedout.
Introduction This presentation will examine: I. Results 1. MLD, upper waters and intermediate water mass variability 1994-2010. 2. Simulation MLD variability 1995-2008 using climatological profiles. II. Discussion 3. Results of the long-term run (19482008). Constrains and reliability 4. Extreme winter mixing of 1963, 1965, 2005. 5. Low-frequencyvariability in MLD and large-scaleatmosphericpatterns. 6. Winter MLD deepening trendsand warming tendencies in the Bay of Biscay? III. Conclusions
Results. 1. MLD, upper waters and intermediate water mass variability 1994-2010. Prevailingfactorsgoverning MLD variability Reproduction of MLD seasonalcycle Winter ~ 200 m. Summer ~ 30 m. Santander standardsection Extreme wintermixing of 2005. 2006 re-emergence Convection + wind stress Convectionprocessesdominatewinter MLD development Wind stress-driventurbulencecontrolssummer MLD variability No wind stress No convection Fig. 3: (a) Temperature and (e) salinity upper layer temporal evolution from observations and from simulations I.A ((b) and (f)), I.B (c) and I.C (d). Black dots in (a) and (e) represent MLD estimation following the (Gonzalez-Pola et al., 2007) algorithm applied to IEOS6 and IEOS7 temperature proles. Black line in (b), (c), (d) and (f) indicates MLD estimated from GOTM model. Kantha & Clayson, 2002; Alexander et al., 2000
Results. 1. MLD, upper waters and intermediate water mass variability: Extreme winter mixing 2005 c w cooling warming Figure 5. (a) Sequence of temperature profiles, color code follows the legend with the October 2006 to December 2007 period changing gradually from yellow to red. (b, c, d, e, f , g and h) Time series of average θ, depth of isopycnal, salinity, potential vorticity, nutrients and chlorophyll at different pressure and isopycnal levels.
Results. 1. MLD, upper waters and intermediate water mass variability: Re-emergence mechanism 2006 Figure 3. Potential temperature anomaly (θ) within the mixed layer (100 dbar) in the Northeast Atlantic in spring 2005 from Argo floats. Re-emergence mechanism from Deser et al. (2003). Reference: Somavilla, R., C. González-Pola, C. Rodriguez, S. A. Josey, R. F. Sánchez, and A. Lavín (2009), Large changes in the hydrographic structure of the Bay of Biscay after the extreme mixing of winter 2005, J. Geophys. Res., 114, C01001, doi:10.1029/2008JC004974.
Results. 1. MLD, upper waters and intermediate water mass variability: Intermediate Water Masses. St7 East North Atlantic Central Water (ENACW). ~27.1-2 Pres ~ 350 dbar Lower bound of ENACW (Sal Min). ~27.2-3 Pres ~ 500 dbar Mediterranean Water (MW). ~27.3-27.6 Pres ~ 1000 dbar (core) Well sampled at the external station 7 (not conditioned by slope flows) Lavín et. al. 2006
Results. 1. MLD, upper waters and intermediate water mass variability: Quantifying water masses changes It is possible to split changes at a fixed depth approximately in two main components (Levitus 1989, Bindoff & McDougall 1994, Arbic & Owens, 2001) : • Thermohaline properties variation at fixed isopycnal levels. • Pure Warming//Freshening[air-sea fluxes variability] • 2. Variations due to vertical displacement of isopycnal levels. • Pure Heave[renewal rates, circulation changes] Approximate expression: 2 Heating at isobaric levels “isobaric change” 1 2 1 Heating at isopycnal levels “isopycnal change”. Modification of the thermohaline structure of the water masses Heating due to isopycnal level displacement “heave”. ‘Same water types’ but different proportions.
Results. 1. MLD, upper waters and intermediate water mass variability: Changes at isopycnals and isobars ENACW Sal Min 27.2// 27.3 ➯ Strong reduction (~7 dbar yr-1). This density level was getting depleted. Restoration in 2005. MW 27.2// 27.3 ➯ 2005 shift triggered a 2-yr isopycnal warming. Isopycnal cooling in 2009, back in 2010 27.1-27.2 ➯ Significant and progressive sinking until 2005. 27.3 stable. Cooling pulse in 2009, back in 2010
Results. 1. MLD, upper waters and intermediate water mass variability: Changes at isopycnals and isobars ENACW Sal Min MW Warming rates at all levels 0.010-0.030 ºC/yr. (~0.020 ºC/yr on average. 0.30ºC in 15 years). Salinity increase ~0.06 in 15 years.
Results. 2005 onwards ENACW: ↕Heave+isop. ↓ → ↑ Sal. Min. ↑ (↔) Isop MW ↑↔ Isop 1. MLD, upper waters and intermediate water mass variability: Overall View, S temporal evolution 1992 to 2005 ENACW: ↑ Heave+isop. 4:1 + Sal. Min. ↑ Heave MW ↑ Isop.
Results. 2. Simulation MLD variability 1995-2008 using climatological profiles. Climatologicalprofilesskillsto reproduce MLD variability Reproduction of MLD seasonalcycle Winter ~ 200 m. Summer ~ 30 m. Extreme wintermixing of 2005. 2006 re-emergence Climatologicalprofiles √ Effect of large scale lateral advection in thermocline water properties and stratification X Inclusion of shelf break advective anomalies MLD HISTORICAL RECONSTRUCTION AND FUTURE SCENARIOS Benefitfor their use in studying the mixed layer along an oceanic large-scale region
Discussion. 3. Results of the long-term run (19482008). Constrains and reliability Somavilla et al., 2009 Climatologicalprofilesbasedontemp. profiles (1994 onwards) ???? Shallower MLD during the 70s and 80s Firstquestions Reliability of atmosphericforcing??? Reliability of atmosphericforcing √ Extreme wintermixing of 1963, 1965, and 2005 Mean Winter Net Heat Loss 105 W·m-2 Mean Winter Net Heat Loss 90 W·m-2
Discussion. 3. Results of the long-term run (19482008). Constrains and reliability. Reliabilityof ‘climatologicalprofiles + NOAA SST decadalwarming’
Discussion. 4. Extreme winter mixing of 1963, 1965 and 2005 Somavilla et al., 2009 1963 Extreme mixingepisode midJanuary: 761 W/m2 MLD from 70 to 150 meters 1965 evenlydistributedmixingepisodes 2005 Extreme mixingepisodes endJanuary and February 764 W/m2 MLD from 150 to 330 meters 1963, 1965, 2005 similar accumulatedbuoyancy flux at theend of thewinter MLD (black line) and net heat loss (blue solid line) during the winters of 1963, 1965 and 2005. Red dots represent MLD estimation following the Gonzalez-Pola et al. [2008] algorithm applied to IEOS6 temperature profiles.
Discussion. 5. Low-frequencyvariability in MLD and large-scaleatmosphericpatterns. Western (BoB) & Eastern lobes Anom. Q0<0 Shallowing trend in MLD Warmer SSTs Subpolar gyre Anom. Q0 >0 Deepening trend in MLD Colder SSTs Net heat loss anomaly in + and – NAO index years + NAO index years Michaels et al., 1996; Paiva et al., 2002 Carton et al., 2008; Henson et al., 2009
Discussion. 5. Low-frequencyvariability in MLD and large-scaleatmosphericpatterns. Western (BoB) & Eastern lobes Anom.Q0 >0 Deepening trend in MLD Colder SSTs Subpolar gyre Anom. Q0<0 Shallowingtrend in MLD WarmerSSTs - NAO index years Michaels et al., 1996; Paiva et al., 2002 Carton et al., 2008; Henson et al., 2009
Discussion. 6. Winter MLD deepening trendsand warming tendencies in the Bay of Biscay? increasing. Q0 Cte. Q0 ++ Deeper MLD Deeper MLD Shallower MLD Shallower MLD SST 1948-2008 Modelled -0.019 ºC/decade NOAA SST recon. +0.026 ºC/decade 200 m. 1980-2008 Modelled 0.224 ºC/decade Observations 0.263 ºC/decade ‘climatologicalprofiles + NOAA SST decadalwarming’ SST SST 200 m. 200 m. t t
Conclusions 1. As expected, at seasonal timescales winter mixed layer development is mostly conducted by convection processes while wind stress is responsible for mixing events during the spring-summer season. 2. Climatological profiles skills have enabled to use them for afirst trial of reproduction of the last sixty years of MLD variability in the study area. Remarkable results have been obtained. An unexpected period of shallower MLDs seem to have occurred during the 1970s and 1980s which would have been concluded from mid1990s onwards by a deepening trend in MLD. 3. The reproduction of sea surface and 200 meters depth temperature time-series and the warming trend at both levels supports the counterintuitive outcome of shallower winter mixed layers concurrent to generalized upper water warming trends reported in several occasions for the area. 4. As found in other recent studies, long term trends in MLD in the southern Bay of Biscay seem to be related with decadal variability in North Atlantic Oscillation (NAO), being in phase and opposition with other cycles of deepening and shallowing trends in MLD found from subtropical-to-subpolar areas in the North Atlantic. 5. Favourable sequence of mixing events results in intense convection processes becoming determinant to explain interannual differences and extraordinary deepening of winter mixed layer as in years 2005, 1963 and 1965.
Many thanks for your attention Reference: Somavilla, R., C. González-Pola, M. Ruiz-Villareal and A. Lavín, 2011. Last sixtyyears of mixed layer depthvariability in the southernBay of Biscay. Deepening of winterMLDs concurrent to generalizedupper water warming trends? Ocean Dynamics. DOI: 10.1007/s10236-011-0407-6
Discussion. 1. Extreme winter mixing of 1963, 1965 and 2005 1963, 1965, 2005 similar accumulated buoyancy flux at the end of the winter Atmospheric pressure anomaly during the winters 1963,1965 and 2005. 1963 1965 2005 Negative state of the North Atlantic Oscillation (NAO) Low-frequency variability pattern of atmospheric pressure identified as the Eastern Atlantic pattern (EATL). Rogers (1990) Reference: Somavilla, R., C. González-Pola, C. Rodriguez, S. A. Josey, R. F. Sánchez, and A. Lavín (2009), Large changes in the hydrographic structure of the Bay of Biscay after the extreme mixing of winter 2005, J. Geophys. Res., 114, C01001, doi:10.1029/2008JC004974.
Introduction This presentation will examine: I. Results 1. MLD, upper waters and intermediate water mass variability 1994-2010. 2. Simulation MLD variability 1995-2008 using climatological profiles. Prevailingfactorsgoverning MLD variability Effects of advectionmantainingmainthermocline Climatologicalprofilesskillsto reproduce MLD variability AIMS: Reconstructionpastevolution of MLD variability Table 1. Resume of theforcingsfields, data sets and time usedforrelaxationpurposes and periodscoveredbythedifferentsimulationscarriedout.