Download
1 / 24
240 likes | 367 Vues
Decadal Variability in the Southern Hemisphere. Xiaojun Yuan 1 and Emmi Yonekura 2 1 Lamont-Doherty Earth Observatory Columbia University 2 Department Environment and Earth Sciences Columbia University Many thanks to D. Martinson, Y. Kushnir and M. Ting for their inputs.

E N D
Decadal Variability in the Southern Hemisphere Xiaojun Yuan1 and Emmi Yonekura2 1Lamont-Doherty Earth Observatory Columbia University 2Department Environment and Earth Sciences Columbia University Many thanks to D. Martinson, Y. Kushnir and M. Ting for their inputs 2012 Ocean Sciences Meeting, February 20-24, Salt Lake City, Utah GloDecH meeting, March 14, 2012
Previous Studies focus on the decadal variability in the ENSO teleconnections 1. Decadal changes is found in the relationships between precipitation/ moisture flux/ pressure fields in the Western Antarctic and ENSO from 1980s to 1990s (Cullather et al., 1996, Bromwich et al., 2000; Fogt and Bromwich, 2006) Correlation between SOI and 500mb height anomaly 1980s Moisture flux convergence in the western Antarctic and SOI 1990s Fogt and Bromwich, 2006 Bromwich et al., 2000
Previous Studies focus on the decadal variability in the ENSO teleconnections 2. Tree ring proxy data reveal a peak at 14 year period from coherency spectrum of reconstructed Summer Trans-Polar Index and the SOI for the period of 1866 to 1984 ( Villalba et al, 1997) Trans-Polar Index Coherency Spectrum
Power Spectra of Four Climate Modes in the Southern Hemisphere Decadal peak
Objective Investigate decadal variability of the Southern Annular Mode and SST Data Weather station pressure and temperature data (READER dataset) Available reanalysis datasets 20th century runs from IPCC coupled climate models Hadley Center’s SST Method Spectrum analysis Spectra peaks are assessed by first order Markov null continuum method. Short Time Fourier transform
SAM Indices Defined as differences of SLP anomalies between 40S and 65S Detrended SAM indices calculated from BAS (black), Visbeck (megenta), ERA40 (red), NCEP (blue) and NCEP-EOF (blue dash line) after 1950. Black straight line is the long-term trend removed from the BAS series. Reconstructed Visbeck annual SAM series (blue) and Fogt seasonal SAM series since 1905 (red). All time series were filtered by a butterworth filter with the filter width of 5 years.
Power Spectra of SAM and SST SST 30-40S SAM SST 50-60S SST 40-50S Dashed lines indicate 95% confidence level, which is assessed by first order Markov null continuum method. SAM is an order 6 autoregressive process.
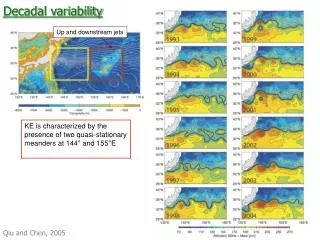
Cross spectrum between SAM and SST at 50-60S mean meridional SST gradient between 30-60S
(a) Power Spectrum of Fogt’s seasonal SAM index (1865-2005) and (b)spectrogram of short time analysis as function of frequency (cycle per season) and center year of each 50-year series. The dash line in (a) indicates the 95% confidence level. Short time Fourier Transform
READER database Turner et al., 2005 Weather station data coverage for sea level pressure (a) and surface air temperature (b). The percentage of missing data for each station is listed at right.
Decadal (8-14 yrs) and interannual (3-7 yrs) Variability in Temperature and Pressure Records at Weather Stations Air temperature Sea Level Pressure
Orcadas Station Air temperature Both decadal and interannual peaks are significant at 95% confidence level Sea Level Pressure Both decadal and interannual peaks are significant at 90% confidence level.
Austral summer (DJF) composite of SST anomalies for (a) high SAM years (1960-65, 1995-2001) and (b) low SAM decades (1970-80).
There are consistent energy peaks at the decadal frequency band in temperature and pressure fields in mid-latitudes of the Southern Ocean, which contribute to the decadal variability in SAM. Do IPCC coupled climate models simulate this decadal variability in the Southern Hemisphere? The SAM index is constructed following Gong and Wang (1999) -- zonal mean SLP anomaly at 40S minus zonal mean SLP at 65S, in 20th century runs of 18 IPCC coupled models
Linear Trend in SAM index from IPCC models entire 20th century runs
Linear Trends in SAM index from IPCC 20th century runs for the period of 1947-1997
Decadal variability in SAM indices, SST of 50-60S and SAM/SST cross spectrum from 18 IPCC AR4 climate models. The 95% (dark grey) and 90% (light grey) confidence levels are shaded. When all model runs are considered, 57% of SAM indices yield significant decadal peaks.
Conclusions Decadal variability dominates the monthly time series of SAM in instrumental data periods. The decadal variability of SLP and air temperature in mid latitudes largely contributes to the decadal variability in SAM. The decadal variability in SAM is likely related to the decadal variability of SST in the subpolar and mid latitude regions of the Southern Ocean. Most IPCC coupled climate models are able to simulate the decadal variability of SAM in their 20th century runs and all models produce the positive long-term trend in SAM. The results suggest that the decadal variability is a natural variability captured by the fundamental physics of these climate models
Thank You! Yuan, X., and E. Yonekura (2011), Decadal variability in the Southern Hemisphere, J. Geophys. Res-Atmospheres., 116, D19115, doi:10.1029/2011JD015673.
Power Spectra of zonal mean NCEP/NCAR reanalysis pressure anomalies as function of latitude bands
Power Spectra of zonal mean NCEP/NCAR reanalysis temperature anomalies as function of latitude bands