Download
1 / 22
220 likes | 354 Vues
Intraseasonal TC prediction in the southern hemisphere. Matthew Wheeler and John McBride Centre for Australia Weather and Climate Research A partnership between Bureau of Meteorology and CSIRO Anne Leroy Meteo-France, Noumea, New Caledonia Frederic Vitart

E N D
Intraseasonal TC prediction in the southern hemisphere Matthew Wheeler and John McBride Centre for Australia Weather and Climate Research A partnership between Bureau of Meteorology and CSIRO Anne Leroy Meteo-France, Noumea, New Caledonia Frederic Vitart European Centre for Medium-Range Weather Forecasts, Reading, UK
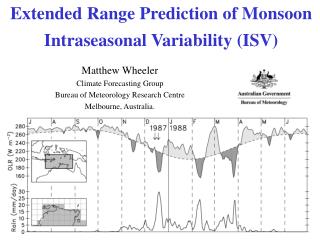
Motivation Our work on this topic started in ~2004. At that time, evidence existed of a relationship between the MJO and TCs. I had also been working on an index for real-time monitoring of the MJO. Together, this allowed us to try making intraseasonal predictions of TCs. TC tracks as a function of RMM MJO phase. Data from 1974-2003. Shading for OLR anoms < -10 Wm-2 From Wheeler and McBride (2011).
This talk will cover 1. The ‘original’ Leroy-Wheeler (2008) statistical scheme for TC prediction (operational since 2006/07) 2. Improvements to this scheme (operational since 2009/10) 3. Dynamical model forecasting of TCs by the ECMWF ‘monthly’ system (Frederic Vitart) 4. Comparison of the statistical and dynamical predictions 5. Conclusions and latest developments
1. Leroy-Wheeler (2008) statistical scheme We examined the probability of formation (i.e. genesis) or occurrence (i.e. including the whole track) during each week (week 1, week 2, week 3, etc) in four regions: Logistic regression was used: where P is the predicted probability of TC formation, and (x1,x2,x3,….,xm) are the multiple predictors. ^
Predictorswere selected from: • MJO – Use the Real-time Multivariate MJO indices (RMM1 and RMM2). 2 predictors • The leading two patterns of Indo-Pacific SST variability (SST1 and SST2). 2 predictors • Climatological seasonal cycle of TC activity. 1 predictor A formal stepwise predictor selection procedure was employed. It selects which predictors to use for each lead and zone.
Forecast examples from 2007/08 (these were produced in real time) Genesis Probability Note: We had a La Nina in 07/08
Hindcast skill (cross-validated hindcasts for 69/70-03/04) Brier skill scores (BSS), expressed as a percentage improvement over a reference forecast strategy that predicts a constant climatology. Using all forecasts (note different scales) Using forecasts from periods of strong MJO activity has greater skill than that shown above.
Independent verification: Reliability of all forecasts (W1, W2, and W3), in all regions, for 06/07 and 07/08 • 20 categories • Area of each dot is proportional to the number of forecasts in category
20 15 2. Improvements to the statistical scheme (1) Generalisation to a grid of multiple smaller overlapping regions covering the entire TC region in the Southern Hemisphere. (2) Use of improved predictors of interannual variability: (a) Nino 3.4 index; (b) Trans-Nino index (Trenberth and Stepaniak 2000); and (c) Indian Dipole Mode index (Saji et al. 1999). This change was partly motivated by significant trends in SST1 and SST2 that are not reflected in trends in TC activity. Our MJO (RMM) and Clim predictors remained the same.
Demonstration of climatological seasonal cycle (Clim) on new grid Probability (%) of occurrence of a TC in each overlapping box
Demonstration of climatological seasonal cycle (Clim) on new grid Late season Highly peaked season Long season Just this is new information, as it provides a knowledge of where and when during a typical season TCs are most likely. The MJO and interannual predictors provide additional information on top of this.
As before, we use step-wise predictor selection. This is the relative importance of each predictor for week 1. 1 = selected first 6 = selected last Blank = not selected For weeks later in the forecast, the relative importance shifts away from the MJO to the interannual predictors.
The web page with the forecasts is at http://www.meteo.nc/espro/previcycl/cyclA.php
Examples that were available on 9th December 2010. MJO was here
3. Dynamical model forecasting of TCs by the ECMWF ‘monthly’ system At the same time as we have been working with these statistical forecasts, the potential of the ECMWF monthly forecasting system to represent the MJO modulation of TC activity has been demonstrated (Vitart 2009). This led us to collaborate with Frederic Vitart to make a comparison. We sent cross-validated hindcasts to Frederic for the same years as he had available from the dynamical model. We then compared with the ECMWF hindcasts for the 20-year period 1989-2008.
Details of the ECMWF model Cy32r3 of the ECMWF monthly system was used (operational version from 2007-2008). First 10 days at T399 (uncoupled), then T255 and couple thereafter. 46-day Hindcasts generated from the 15th day of each month with 15 ensemble members. TC-like vortices are tracked in the model and the ensemble is used to generate the forecasted TC probabilities. Raw model output produced about 30% too many TCs, so a simple calibration was applied to reduce its forecast probabilities. Raw=ECMWF Calibrated=CECMWF Vitart, Leroy, and Wheeler (2010)
4. Comparison of the statistical and dynamical predictions Verification over the same ‘new’ grid we produced for the statistical model. A. Brier Skill Scores Vitart, Leroy, and Wheeler (2010)
B. Reliability Vitart, Leroy, and Wheeler (2010)
A multimodel combination MULTI equals simple average of STAT and CECMWF Vitart, Leroy, and Wheeler (2010)
5. Conclusions and latest developments The statistical model has allowed us to learn about the mechanisms and sources of intraseasonal TC predictability, and the procedures for making forecasts and their verification. However, calibrated ECMWF forecasts have convincingly higher Brier Skill Scores than the statistical model, although not always more ‘reliable’. Greatest skill was obtained from a multimodel combination of the statistical and dynamical predictions. ECMWF went operational with intraseasonal TC forecasts for the member states in January 2011. 32-day forecasts are produced and issued once per week on a Thursday. Later this year they will also be produced and issued on a Monday. ECMWF is now producing a new set of hindcasts with a more recent version (T639/T319) of the model. The same verification procedures will be applied. Meteo-France (Anne Leroy, New Caledonia) will continue to provide real-time statistical forecasts for understanding and as a benchmark for other techniques. During 2010/11 the scores were “rather good” over the Pacific and Western Indian oceans.
Real-time ECMWF forecasts issued for the week of TC Yasi Days 12-18 Days 5-11 Days 26-32 Days 19-25