Download
1 / 14
140 likes | 248 Vues
This study explores the multi-decadal variability in annual temperatures across the Southeastern U.S., identifying warm (1920-1957) and cold (1958-1998) regimes. Key objectives include characterizing seasonal patterns, spatial coherence, and the impact of this variability on temperature extremes. Analysis reveals stronger signals in winter and summer seasons, with differences in mean temperatures and occurrences of temperature extremes. The findings aim to understand the causes behind these shifts and assess if similar patterns will emerge in the future.

E N D
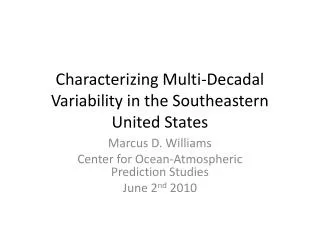
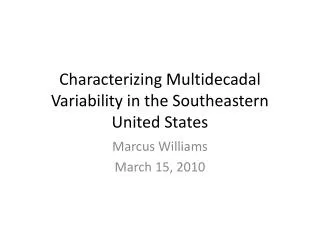
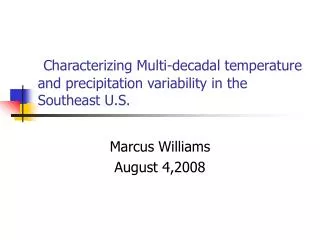
Multi-Decadal Variability in the Southeastern United States Marcus D. Williams March 15, 2010
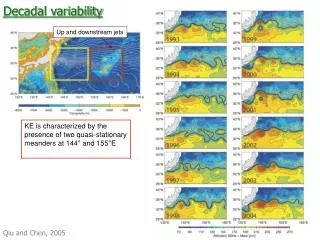
Multidecadal Variability in the Southeast Alabama Annual Temperature Warm period 1920-1957 Cold period 1958-1998
Same multi-decadal pattern is displayed in the raw, unadjusted station data • 1920-1957: Warm regime (WR) • 1958-1998: Cold regime (CR) Cold period 1958-1998 Warm period 1920-1957
Objectives • Characterize the nature of multi-decadal temperature variability in the Southeastern United States • Seasonality • Spatial Coherence • Extremes • Magnitude in comparison to other variability • Is the signal of the variability more prevalent in any particular season • Is the variability affecting the occurrence of temperature extremes
Seasonality • To examine the regime shift, Probability Distribution Function (PDF) plots where created for all seasons at each station • The PDF plots allow examination of the regime shift at all ranges of temperatures as well as the mean for the chosen season. • Winter and Summer max and min temperatures show the strongest signal. Signal present in Spring and Fall, although not as strong and consistent as Winter and Summer. • Signal weak in Florida Summer max and min temperatures • Signal also dampened by proximity of station to water and in the mountain regions
Difference in Mean • Difference in the mean temperatures between the CR and WR
Shift in occurrences of extremes • With the shift displayed in the temperature PDF’s, one would expect an increased occurrence of temperatures at the tails of the distribution • Thresholds were set at 32°F and 95°F and counts of occurrences per year where made. • As expected there was a difference in the in the occurrence of 32°F and 95°F between the warm and cold regime. • Talladega (AL), Lake City (FL), and Chapel Hill (NC) will be used as examples to illustrate this point
Talladega, AL • Substantial shift in the number of days temperature reached 95°F or higher
Summary • Clear shift in temperature regime between the periods 1920-1957 (WR) and 1958-1998 (CR) • Signal strongest during winter season and slightly damped by proximity to mountains and bodies of water • Why? • Continental Air masses from upstream contributing to variability (Anthony Arguiez) • Signal damped during the summer season in Florida because of tropical climate dominated by the Bermuda High ( guesswork) • Number of days at or above 95°F increased for the WR • Number of days at or below 32°F increased for the CR • Questions to be answered • Test the independence of data to verify statistical significance of regime shift • What are the causes for this multi-decadal shift in temperatures and is the signal present in future regions of the Southeastern U.S.