Download
1 / 25
250 likes | 269 Vues
Explore UV-visible spectroscopy using Vernier SpectroVis Plus to measure transmission, absorbance, and fluorescence spectra of common liquids. Learn about Beer’s law, light scattering, and fluorescent compounds in this hands-on experiment.

E N D
Spectroscopy II - Transmission, Absorption, Fluorescence, Beer’s law and Scattering. Spectrophotometry and Fluorometry In this experiment you will use the Vernier SpectroVis Plus, a small, computer controlled Spectrophotometer + Fluorometer to measure the Transmission and Absorbance spectra of some common liquids from 380-950 nm. In addition, you will measure the Fluorescence spectrum of Olive Oil for excitation at 405 and 500 nm. In the process you will learn about Beer’s law and verify its dependence on the number density of particles. You will also learn a little about light scattering and how to detect it by using the Fluorometer mode for non-fluorescent but scattering samples.
Vernier SpectroVis Plus Spectrophotometer + Fluorometer (shown with sample cuvettes, not shown with USB cable)
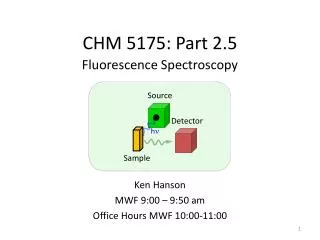
How Does the SpectroVis Plus Work? Light from the LED and tungsten bulb light source passes through a solution. Emerging light goes through a high-quality diffraction grating, then the diffracted light is collected and sorted by the CCD array detector. Fluorescent light is scattered at right angles (RA fluorescence) to the excitation light sources (LED’s) to minimize light detected at the excitation wavelength(s).
Specifications for the Spectro Vis Plus Wavelength Range: 380 nm–950 nm Support for fluorescence (two excitation sources centered at 405 nm and 500 nm) Reported Wavelength Interval: 1 nm between reported values (collects 570 values) Optical Resolution: ~ 2.5 nm Dimensions: 15 cm x 9 cm x 4 cm Light Sources: Incandescent white bulb, approximately 8000 hour lifetime, LED-based, approximately 100,000 hour lifetime One-step calibration No external power required
I I0 l
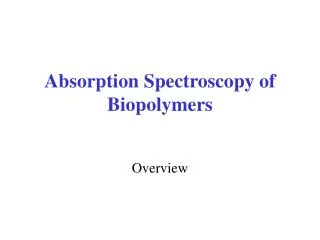
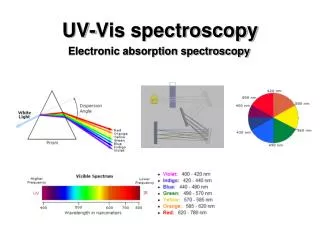
The Beer-Lambert law helps to correlate the intensity of absorption of UV-visible radiation to the amount of substance present in a sample. The Beer-Lambert law has been widely used in many fields of pharmaceutical sciences, chemistry and quantification testing. It allows UV-visible spectroscopy to be useful as not just a qualitative but also a quantitative tool. In physics, it is often used to calculate the attenuation in optical fibers and materials, as well as the atmosphere.
Absorbance spectra of Chlorophyll a and b The absorption peaks of chlorophyll a are at 665 nm and 465 nm. Chlorophyll afluoresces at 673 nm (maximum) and 726 nm. The peak molar absorption coefficient of chlorophyll a exceeds 105 M−1 cm−1, which is among the highest for small-molecule organic compounds.
Fluorescent molecules are compounds that absorb light of one wavelength, then re-emit light at a longer wavelength. This emitted light can be quantified using fluorescence spectroscopy. Molecular and cellular biologists use fluorescent compounds to label proteins, gels, and even cellular organelles. In many ways, fluorescent compounds have revolutionized research in the life sciences. Fluorescence spectroscopy is also used in the characterization of laser materials. Jablonski diagram. After an electron absorbs a high energy photon the system is excited electronically and vibrationally. The system relaxes vibrationally, and eventually fluoresces at a longer wavelength. In this lab you will observe the fluorescence of extra virgin Olive Oil and compare to its transmission and absorption spectrum. http://en.wikipedia.org/wiki/Fluorescence
Space-filling model of the chlorophyll a molecule (from Wikipedia ) Structure of chlorophyll a
What you are going to do 1.) In the first part of the experiment, you will measure the Transmission, Absorbance, and Fluorescence spectra using 405nm and 500nm excitation light of a sample of Extra Virgin Olive Oil and compare the various features of each type of spectrum. You should make some thoughtful comments and discussion on the differences between the graphs and what they mean. Read the referenced articles for additional information. What color is the Chlorophyll fluorescence? Note that shining a 405nm or 532nm laser on green plant leaves produces a bright chlorophyll fluorescence. Try this on spinach lettuce, regular lettuce, spinach juice, and some (living) green plant leaves. To do this you just select from the Experiment menu > Change Units Spectrometer and choose the appropriate spectrum type, Transmission, Absorbance, Fluorescence 405nm or Fluorescence 500nm. Make sure you select calibration before taking any spectra. The software will prompt you to put in a blank cuvette. Copy your screen graphs with appropriate ranges (make sure you vertically expand your vertical scales so that the features of the spectra are well displayed and take up most of the vertical scale) into a word document. Similarly, be sure you have wavelength plots over the entire 380-950nm range. If you want to examine a feature in more detail, you can expand the horizontal wavelength scale to be a smaller range around the feature you are interested in.
What you are going to do (more detailed procedure in following slides) 2.) In the second part of this experiment we will measure the absorbance spectrum of a solution of Green tea as a function of the volume of the solution, starting from a high concentration and adding known volumes of water to dilute it. It is important in this part of the experiment NOT TO SPILL OR LOSE ANY OF THE SOLUTION, OTHER THAN THE FIRST REDUCTION OF SOLUTION AFTER THE FIRST ABSORBANCE SPECTRUM TO A STANDARD VOLUME OF 2 ml. The experiment assumes that the number of molecules in the total volume of solution (that is cuvette plus graduated cylinder) remains constant while the total volume is increased.
Beer’s Law Experiment Good discussion of the Beer Lambert law http://en.wikipedia.org/wiki/Beer-Lambert_law
Procedure: Prepare a green tea solution of sufficient concentration to produce a peak absorbance of at least 1.5 around 397 nm. This should already be available in class. Verify your initial solution has sufficient absorbance. Procedure… (from Steve Mahrley, 11/2/2012) A cuvette holds approximately 3.6 mL. · I initially ran Absorbance with full cuvette/concentration and saved the file as * 2 mL. · I filled the (10 ml) Graduated Cylinder to 2 mL and dumped the rest of the cuvette contents down the drain (see note!). I added water to 4 mL, ran the program again and saved it as *.4 mL. · I poured the entire cuvette into the GC, checked to make sure the volume was still 4 mL, then added water to 6mL. · Ran the program, saved as 6 mL. · Repeated this for 8mL and 10mL · I did this for both green tea and Gatorade fruit punch NOTE: After the first reduction of the initial cuvette volume to 2mL, DO NOT THROW AWAY OR LOSE ANY SOLUTION! The laboratory experiment assumes that the total number of molecules remains constant while the volume is increased.
Make data tables of Absorbance A vs. Volume V and plot 1/A vs. the volume for a wavelength which starts out with an absorbance of about 1 (428.8 nm in the following example), and also for the peak wavelength of about 397nm. (use your actual values)
To analyze the data on Absorbance as a function of dilution volume Plot the 1/A vs. wavelength data from the tables for the off peak and peak wavelengths for each of the sample volumes, including the starting volume of 2ml (i.e. 2, 4, 6, 8, and 10 ml). For the off-peak wavelength, fit a linear trend line with the option “set intercept = 0” ENABLED. (this is a trendline option) For the on-peak wavelength, fit a linear trend line with the option “set intercept = 0” DISABLED. (this is a trendline option, default does not force the intercept to zero). Make sure your graphs are properly formatted and titled, as in the following examples
Off peak wavelength obeys Beer’s law over this range of concentration. Note the forced fit with intercept of zero fits the data nicely.
On peak wavelength deviates noticeably from Beer’s law over this range of concentration. Note the non-zero intercept required to fit the data. Fit with zero intercept gives lower R^2 value with poor fit.
So the off peak wavelength produces a good fit to Beer’s law, while the peak wavelength requires a non-zero intercept, although the concentration dependence was still linear. There are several factors which can produce deviations from Beer’s law. Under certain conditions Beer-Lambert law fails to maintain a linear relationship between absorbance and concentration of analyte. These deviations are classified into three categories: Real Deviations - These are fundamental deviations due to the limitations of the law itself. Chemical Deviations- These are deviations observed due to specific chemical species of the sample which is being analyzed. Instrument Deviations - These are deviations which occur due to how the absorbance measurements are made.
There are at least six conditions that need to be fulfilled in order for Beer’s law to be valid. These are: 1.) The absorbers must act independently of each other; 2.) The absorbing medium must be homogeneous in the interaction volume 3.) The absorbing medium must not scatter the radiation – no turbidity (not true, can have single scattering, just not multiple scattering effects); 4.) The incident radiation must consist of parallel rays, each traversing the same length in the absorbing medium; 5.) The incident radiation should preferably be monochromatic, or have at least a width that is narrower than that of the absorbing transition; and 6.) The incident flux must not influence the atoms or molecules; it should only act as a non-invasive probe of the species under study. In particular, this implies that the light should not cause optical saturation or optical pumping, since such effects will deplete the lower level and possibly give rise to stimulated emission. If any of these conditions are not fulfilled, there will be deviations from Beer’s law. Some of them are discussed in more detail here. http://pharmaxchange.info/press/2012/05/ultraviolet-visible-uv-vis-spectroscopy-%E2%80%93-limitations-and-deviations-of-beer-lambert-law/