
SlideServe
Menu
Préférences
© SlideServe · v2026

Understanding Demand Elasticity, Tax Incidence, and Consumer Surplus in Economics

aerona avatar
8 diapositives · 227 Views · Aug 22, 2014

This guide covers essential concepts in economics, focusing on demand elasticity, the impact of taxes on seller and buyer surplus, and the calculation of consumer and producer surplus. It explains how to determine elasticity using the mid-point method, identifies when demand becomes less elastic along a demand curve, and discusses the effects of taxes on market equilibrium. The material also provides insights on deadweight loss and government revenue, demonstrating how externalities impact overall welfare in markets like cigarettes.
Understanding Demand Elasticity, Tax Incidence, and Consumer Surplus in Economics - slide 1
01 / 8Understanding Demand Elasticity, Tax Incidence, and Consumer Surplus in Economics
1 / 17

Télécharger la présentation

Understanding Demand Elasticity, Tax Incidence, and Consumer Surplus in Economics
Une image / un lien ci-dessous est fourni (tel quel) pour télécharger la présentation

Politique de téléchargement : le contenu du site vous est fourni TEL QUEL pour votre information et votre usage personnel ; il ne peut être vendu, concédé sous licence ni partagé sur d’autres sites sans l’accord de son auteur.Le contenu vous est fourni TEL QUEL, pour votre information et votre usage personnel uniquement. Téléchargez la présentation en cliquant sur ce lien. Lors du téléchargement, si vous ne parvenez pas à télécharger une présentation, l’éditeur a peut-être supprimé le fichier de son serveur.Pendant le téléchargement, si vous ne parvenez pas à obtenir une présentation, le fichier a peut-être été supprimé par l’éditeur.

F I N

Plus de contenu associé

Transcription de la présentation
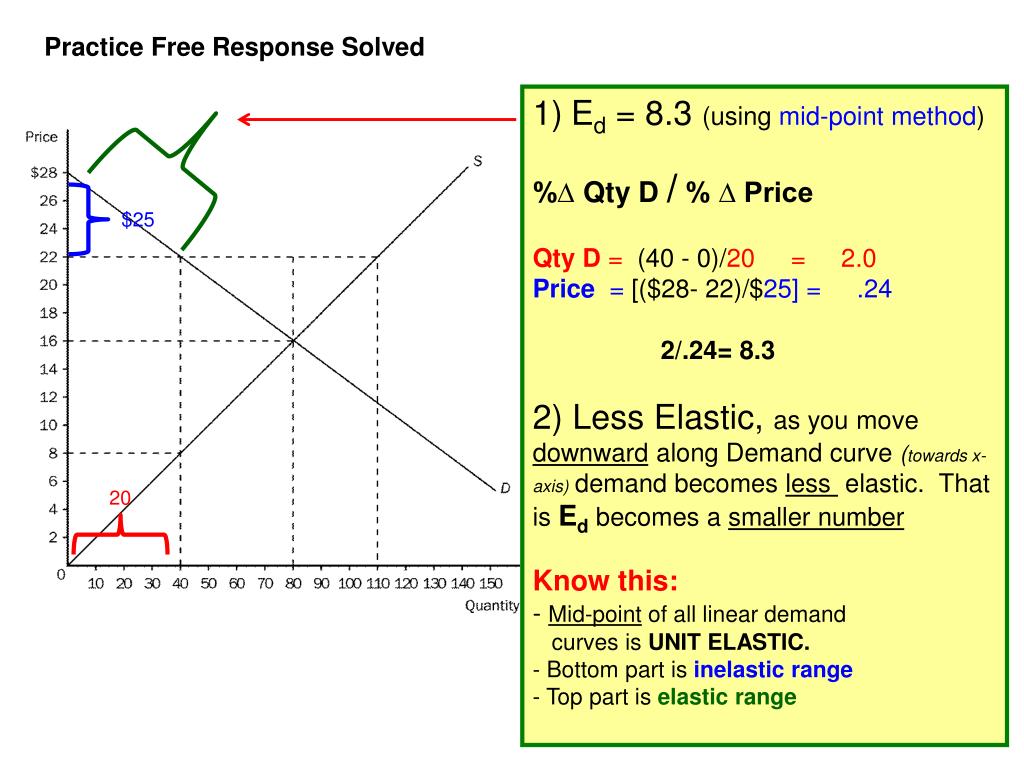
  1. Practice Free Response Solved • Ed = 8.3 (using mid-point method) • %∆ Qty D / % ∆ Price • Qty D = (40 - 0)/20 = 2.0 • Price = [($28- 22)/$25] = .24 • 2/.24= 8.3 • 2) Less Elastic, as you move downward along Demand curve (towards x-axis)demand becomes less elastic. That is Ed becomes a smaller number • Know this: • - Mid-point of all linear demand • curves is UNIT ELASTIC. • - Bottom part is inelastic range • - Top part is elastic range $25 20

  2. Practice Free Response Handout Solved • 3) Calculate Original: • 480 consumer surplus • 640 producer surplus • 1120 total welfare • Zero loss of welfare • 4) Tax of $14 on sellers • Modify…. • 22 buyers pay • 8 seller receive • 560 tax revenue • 120 new c.s. • 160 new p.s. • 280 deadweight loss • 840 total surplus • 5) Sellers--more inelastic curve has Higher tax incidence • Buyers pay $6 of tax • Sellers pay $8 of tax S2 $14 Tax on sellers CS Deadweight loss TAX REVENUE PS You shift the supply curve because the tax was on sellers-but draw the wedge first!

  3. 6) Ed < 1 (inelastic) • No good subs, necessity • 7) See graph • buyer pays more Sellers receive less • Qty sold falls • ii) – iv) labeled on graph • v) CS + PS + Tax Revenue • 8) See below: • Qty falls more, Sellers pay more, buyers pay less • ii) Less Gov’t revenue • Shared more equally • (buyer paid most of tax before) • Bigger DWL • (quantity shrinks more) Cigarettes Tax Revenue CS PB TAX REVENUE Deadweight Loss P1 E1 PS PS 4) ----------------- Q2 Q1 Notice buyers pay most of tax & DWL is small because of inelastic demand!

  4. 9) Spillover Costs of Smoking Tax suppliers the exact size of the spillover cost (external cost) Total Welfare would rise even though the market Shrinks Both external & internal costs!

  5. Basic Tax Example & DWL

  6. Price Ceiling & DWL

  7. Subsidy & DWL (

  8. Subsidy & DWL ( . .