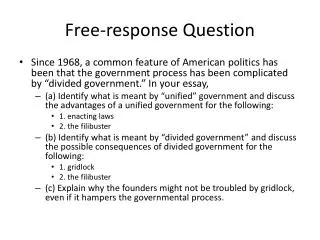
Economic Decision-Making in Competitive Markets
Learn how to optimize profit levels and make key economic decisions in competitive markets by analyzing cost and revenue data. Understand the relationships between marginal cost, average total cost, and production levels to maximize efficiency and profits.


Economic Decision-Making in Competitive Markets
E N D
Presentation Transcript
Practice Free Response Answer Key
a) QTY TC MC ATC AVC TVC
ATC S 1 B $9 $9 $6 A D 2 D 1 Q Q 2 1 Profit 1- Firm Market MC Price Price B MR2 = D2 ______________ AVC = D MR A .………….. $6 ----------------------- ------------------ AFC 6 0 0 5 Quantity (market) Quantity (firm) b) i) 5 units => set MR = MC ii) zero economic profit (P-ATC )* Qty d) i) 6 units set MR = MC ii) profit is $15 dollars e) i) Shutdown when price $1.75 because P < AVC. ii) Exit long run P < ATC f) i) Stay open if price is $2 or higher (min of AVC) ii) Exit in long run unless price is $6 or higher (min of ATC)
10) MP crosses AP at max (as MP falls, worker efficiency falls) 11) MC crosses both AVC & ATC at min 12) Yes, MC determines change in AVC & ATC 13) Diminishing marginal returns ensures that MP must eventually fall => when MP falls => MC must rise (leads to upward sloping MC curve as workers become less efficient)