Download
1 / 10
100 likes | 224 Vues
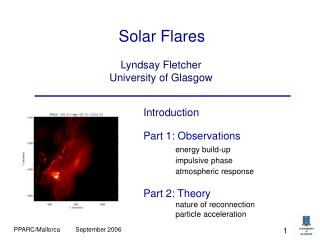
Space weather effects on the Mars ionosphere due to solar flares and meteors. Paul Withers 1 , Michael Mendillo 1 , and Dave Hinson 2 1 - Boston University, USA 2 – Stanford University, USA (withers@bu.edu) EPSC2006-A-00190 Monday 2006.09.18 16:15-16:30 EPSC 2006, Berlin, Germany.

E N D
Space weather effects on the Mars ionosphere due to solar flares and meteors Paul Withers1, Michael Mendillo1, and Dave Hinson2 1 - Boston University, USA 2 – Stanford University, USA (withers@bu.edu) EPSC2006-A-00190 Monday 2006.09.18 16:15-16:30 EPSC 2006, Berlin, Germany
Typical Ionospheric Profiles Earth (Hargreaves, 1992) F layer due to EUV photons E layer due to soft X-rays D layer due to hard X-rays Soft ~ 10 nm, hard ~ 1 nm Mars (MGS RS data) Main peak at 150 km due to EUV photons Lower peak at 110 km due to X-rays. Lower peak is very variable and often absent
MGS electron density profiles from 15 and 26 April 2001 One profile on each day shows enhanced electron densities at low altitudes (red) Percentage difference between the enhanced profile and the average non-enhanced profile No difference above 120 km 100% difference at 100 km, so densities have doubled Difference increases as altitude decreases
Solar flux at Earth measured by GOES satellites Dashed line is 1 – 8 A, solid line is 0.5 – 3 A Arrow marks the time of the enhanced profiles at Mars 15 April = X14.4 flare 26 April = M7.8 flare
Plots of NmE versus UT for Chilton, Millstone, Wallops, and Sondrestrom on 15 and 26 April Shaded areas represent one standard deviation about the mean for April 2001 Dots are ionosonde measurements Vertical dotted line marks time of solar flare No data after X14.4 flare on 15 April NmE increased after M7.8 flare on 26 April
Meteors at Mars Typical altitude is 80 – 90 km Same as models Typical peak electron density is 1 – 2 x 10⁴ m-3 Same as models Typical thickness is 10 – 20 km Narrower than models predict Suggests a large eddy diffusion coefficient Meteors X-rays EUV
Seasonal Trends One meteor layer every 200 profiles Meteor layers are not randomly distributed in Ls Concentrations at Ls~190 (Asteroid 2102 Tantalus?) and at Ls~210 meteor 0 1 11 16 total 295 1572 1882 1851
Meteor Layer Altitude Meteor layer altitude from 2002-2003 data correlates with peak electron density No correlation for 2004-2005 data Conclusion Something that controls meteor layer altitude varied during the observations Something that controls peak electron density also varied during the observations
Meteor Layer Thickness Meteor layer thickness from 2004-2005 data correlates on peak electron density No correlation for 2002-2003 data Implication We can examine the observational conditions carefully and determine what variable is controlling these changes in meteor layer altitude and thickness
Conclusions • Mars ionosphere is affected by solar flares • Mars ionosphere is affected by meteors • Data analysis and theoretical modelling can determine properties of solar flares and meteors. Can also determine properties of ionosphere that are involved in the ionospheric response to these aspects of space weather.