Download
1 / 14
150 likes | 288 Vues
Modeling the effects of solar flares on the ionosphere of Mars. Paul Withers, Joei Wroten, Michael Mendillo, Phil Chamberlin, and Tom Woods (withers@bu.edu) EGU07-A-05089 Tuesday 2007.04.17 09:45 – 10:00 EGU Meeting 2007, Vienna, Austria. A Typical Mars Ionospheric Profile.

E N D
Modeling the effects of solar flares on the ionosphere of Mars Paul Withers, Joei Wroten, Michael Mendillo, Phil Chamberlin, and Tom Woods (withers@bu.edu) EGU07-A-05089 Tuesday 2007.04.17 09:45 – 10:00 EGU Meeting 2007, Vienna, Austria
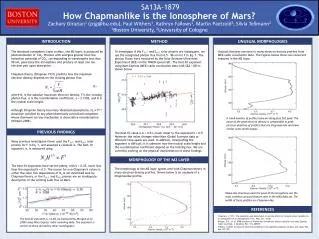
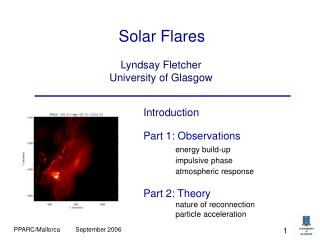
A Typical Mars Ionospheric Profile Transport important above ~180 km Main peak at 140 km due to EUV photons Lower peak at 110 km due to X-rays. Each X-ray that is absorbed produces multiple ion-electron pairs “secondary ionization” MGS Radio Science data Outline of talk: Observations of Mars ionosphere during a solar flare Model description Models of Mars ionosphere during a solar flare Conclusions • CO2 + hv -> CO2+ + e • (production) • CO2+ + O -> O2+ + CO • (chemistry) • O2+ + e -> O + O • (loss)
Enhanced electron densities seen below 120 km in one of six profiles on each day Relative increase in electron density increases as altitude decreases Suggests that relative increase in flux is greatest at shorter, more penetrating wavelengths Factor of two increase in electron density at 100 km suggests factor of four increase in relevant ionizing flux. Optical depth ~ 1 at 100 km for 5 nm photons. Tens of similar examples in the 5600 MGS profiles
Electron density at 110 km for enhanced profile SOHO/EIT image at 19.5 nm at flare onset X-ray flux (0.1 to 0.8 nm) measured in Earth orbit. Flux increases by 2-3 orders of magnitude
BU Photochemical Mars Ionosphere Model • Neutral atmosphere derived from Bougher MTGCM model • Absorption and ionization cross-sections from Schunk and Nagy Ionospheres book (l > 5 nm) and theoretical models of Verner (l < 5 nm) • Reaction rates from Schunk and Nagy Ionospheres book • Secondary ionization parameterized as function of altitude based on results of Fox
Solar Irradiances at Earth • Solar2000 (Tobiska) • 39 or 867 bins from 1.8 – 105.0 nm • One spectrum every day • Empirical model • Flare Irradiance Spectral Model (Chamberlin) • 195 bins of 1 nm width from 0.5 – 195.5 nm • One spectrum every minute • Empirical model based on TIMED SEE, UARS SOLSTICE, GOES • Irradiances resampled so that we have 20 bins shortward of 5 nm, 37 bins longward of 5 nm • Spin up with Solar2000, then transition to FISM • No previous Mars ionosphere model has used time-varying solar irradiance (?)
Time of flare-enhanced profile = 14:14 UTC, 8.7 hrs LST, • 72 o SZA (84 oN) • SZA = 71o 1 hr earlier and • 73o 1 hr later – very small changes in Ne(z) due to this
Conclusions • Observations show ionosphere responding to solar flares • Photochemical model with time-varying solar flux can reproduce the basic characteristics of flare-affected profiles • Secondary ionization parameterization is important • Detailed comparisons between data and models are planned