Download

1 / 25
250 likes | 407 Vues
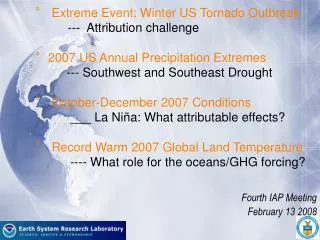
° November-January 2008 Conditions ___ La Niña: What attributable effects? ° Explaining the 2007 Hurricane Season ---- Why the reduction in actiivty &forecast failure? ° China weather during January 2008 ---- Did La Niña play a role?. Fifth IAP Meeting March 12 2008. OND 2007.

E N D
° November-January 2008 Conditions ___ La Niña: What attributable effects? ° Explaining the 2007 Hurricane Season ---- Why the reduction in actiivty &forecast failure? ° China weather during January 2008 ---- Did La Niña play a role? Fifth IAP Meeting March 12 2008
OND 2007 NDJ 2008
OND Composite La Niña 1950 ‘56 ‘71 ‘74 ‘76 ‘89 ‘99 ‘00
November-January 2008 200 Z Anomalies Attributable to East Tropical Pacific SSTs?
Simulated NDJ La Nina 150-member multi-model
Simulated NDJ 2008 150-member multi-model
OBS 2008 OBS Composite Difference
Simulated November- January 2008 Anomalies GOGA, 150-member multi-model
Simulated November- January 2008 Anomalies EPAC, 150-member multi-model
Explaining the 2007 Hurricane Season NOAA’s Accumulated Cyclone Energy (ACE) index expressed as percent of the 1951-2000 median value
August-October 2007: 200-hPa heights (solid contours, m), height anomalies (shaded), and vector winds.
The NOAA forecast, even at the shortest lead time, anticipated the 2007 Atlantic Hurricane Season to rank in the top 10 of all years since 1950. Bell et al. in the “2007 North Atlantic Hurricane Season: A climate perspective”, propose the following post-mortem assessement: 1 . The failed forecast was related to an absence of a La Nina signal in the MDR region, despite the development of La Nina, as expected. 2. The relative inactivity of the 2007 hurricane season, as measured by ACE, was attributed to “anomalous tropical convection throughout SE Asia, the Indian Ocean, and Indonesia, which was more typical of El Nino rather than La Nina..."
August-September PCPN Anomalies2007 vs 2005 Obs. Model
PCPN Attribution N. Atl. ENSO non-ENSO
August-September Vertical Wind Shear Anomalies2007 vs 2005 Obs. Model
Wind Shear Attribution ENSO non-ENSO N. Atl.
Wind Shear: Western Pacific Impact Forcing 200 hPa Hight & Wind Wind Shear
Assessment • Local Atlantic SST in the MDR was colder in 2007 compared to 2005, and this change is judged to have been less favorable for hurricane development in 2007. • Remote western Pacific Ocean warm SST and increased convection in 2007 was very different from conditions seen in 2005. The vertical wind shear over the Atlantic MDR is found to be sensitive to this 2007 condition, generating wind anomalies that are judged to be unfavorable for hurricane development in MDR. * The change in ENSO forcing from 2005 to 2007; El Niño replaced by La Niña, is found to induce a more favorable very wind shear for hurricane development over environment over the MDR. However, we find this factor to have been overwhelmed by the changes in SSTs outside the ENSO region.
What are the Official Forecast for US winter climate? 0.5 month Lead 1.5 month Lead
What are the Official Forecast for US winter climate? 1.5 month Lead 0.5 month Lead