Download
1 / 42
420 likes | 584 Vues
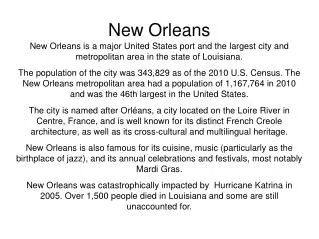
Serving the Needs of New Orleans. presented to The Louisiana Board of Regents February 8, 2011. Louisiana Parish by Parish Population, 2010. Source: http://www.louisiana.gov/Explore/Population_Projections/. Louisiana Total Population Change by Parish, 2010-30.

E N D
Serving the Needs of New Orleans presented to The Louisiana Board of Regents February 8, 2011
Louisiana Parish by Parish Population, 2010 Source: http://www.louisiana.gov/Explore/Population_Projections/
Louisiana Total Population Change by Parish, 2010-30 Source: http://www.louisiana.gov/Explore/Population_Projections/
Louisiana Total Population Change by Parish, Age 15-24 2010-30 Source: http://www.louisiana.gov/Explore/Population_Projections/
Louisiana Total Population Change by Parish, Age 25-44 2010-30 Source: http://www.louisiana.gov/Explore/Population_Projections/
Projected Orleans Population by Race, All Ages, 2010-30 Source: http://www.louisiana.gov/Explore/Population_Projections/
Projected Orleans Population by Race, Ages 15-24, 2010-30 Source: http://www.louisiana.gov/Explore/Population_Projections/
Projected Orleans Population by Race, Ages 25-44, 2010-30 Source: http://www.louisiana.gov/Explore/Population_Projections/
Percent of Adults with an Associate Degree or Higher by Age Group – Orleans Parish, Louisiana, U.S. & Leading OECD Countries Source: OECD, Education at a Glance 2010
Percent of Population Ages 25-64 with an Associate Degree or Higher, 2009 Source: U.S. Census Bureau, 2009 American Community Survey
New Orleans Region - Percent of Population Age 18-24 by Education Level and Race, 2009 Source: U.S. Census Bureau, 2009 ACS PUMS File.
New Orleans Region - Percent of Population Age 24-44 by Education Level and Race, 2009 Source: U.S. Census Bureau, 2009 ACS PUMS File.
2006-2010 ACT ResultsOrleans, Louisiana, and National Scores from the laboratory schools (Grambling State University Lab High School, Louisiana State University Lab School, and Southern University Lab School), and other schools such as the Louisiana School for Mathematics, Science and the Arts, are not included in the district averages, but are included in the state averages. The district averages include scores for public school students; the state and national averages include scores for public and nonpublic school students. Source: American College Test (ACT) data file Louisiana Department of Education Strategic Research and Analysis, November 2010
2010 ACT ScoresOrleans, Louisiana, and National Average scores are not reported for schools with fewer than ten students who took the 2010 ACT, but are included in the district, state, and national averages. The district averages include scores for public school students only; the state and national averages include scores for public and nonpublic school students. Source: American College Test (ACT) data file Louisiana Department of Education Strategic Research and Analysis, November 2010
Distribution of ACT Composite Scores - Two-Year Average (UNO 2007-08, SUNO 2006-07) Source: Louisiana Board of Regents
First-Time Undergraduates Directly Out of High School as a Percent of High School Graduates by Parish of Origin2006-08 Annual Average Source: Louisiana Board of Regents
First-time undergraduates Directly Out of High School as a Percent of High School Graduates2006-08 Annual Average
If Orleans Parish Residents Were to Participate in College at Rates of Residents of
Institutions in Which Residents of Orleans Parish Enrolled as Freshmen, 2009-10 Source: Louisiana Board of Regents
Fall 2009 Enrollments in New Orleans Public Institutions Source: IPEDS
Fall 2009 Enrollments in New Orleans Public Institutions - % African American Source: IPEDS
Percent First-Time Freshmen Enrolled in Developmental Education Fall 2009 Source: Louisiana Board of Regents
Transfers of Students Who Enrolled as First-Time Freshmen at Delgado – Total for Years 2008-09 Source: Louisiana Board of Regents
Transfers of Students Who Enrolled as First-Time Freshmen at UNO – Total for Years 2006-09 Source: Louisiana Board of Regents
Transfers of Students Who Enrolled as First-Time Freshmen at SUNO – Total for Years 2006-09 Source: Louisiana Board of Regents
Delgado Graduation Rates Source: Louisiana Board of Regents
SUNO Graduation Rates Source: Louisiana Board of Regents
UNO Graduation Rates Source: Louisiana Board of Regents
Undergraduate Awards as a Percent of FTE Undergraduate Enrollments, 2008-09 Source: IPEDS
Proportion of Degree Recipients Who AreAfrican-American -- Number of recipients who are African-American Source: IPEDS
Percent of Faculty by Institution and Race, 2007 Source: NCHEMS NCES IPEDS Fall Staff Survey, 2007
Summary Observations • Significant Educational Needs of New Orleans African American Population • Pipeline Leaks at Every Point • High School Graduation • College Participation • College Completion • Not Served Well By the Status Quo • Relates to All Three Public Institutions • Not Just a SUNO/UNO Issue. Delgado Must Be Included
Criteria For Assessing Organizational Alternatives for New Orleans • Aligns academic programs and support services with the needs of New Orleans • Students • Employers • The City • Provides services that recognize the needs of students with different backgrounds, levels of academic preparation, and interests. The structure must foster best practices in serving each different student subpopulation in order to achieve student success and degree/certificate completion
Criteria (Continued) • Supports and promotes good practice in promoting student learning: • “Seven Principles of Good Practice” in undergraduate education (Gamson and Chickering ) • Encourages contact between students and faculty • Develops reciprocity and cooperation among students • Encourages active learning • Gives prompt feedback • Emphasizes time-on-task • Communicates high expectations • Respects diverse talents and ways of learning • Effective Educational Practice (NSSE) • Level of academic challenge • Active and collaborative learning • Student-faculty interaction • Enriching educational experiences • Supportive campus environment
Criteria (Continued) • Aligns institutional processes with successfully meeting the priority needs of clients • Determination & statement of mission • Promotion & tenure • Development, review & approval of academic programs • Promotes strong relationships with key external constituents • P-12 system • Employers • Workforce & economic development agencies
Criteria (Continued) • Makes efficient use of facilities & technology • Classrooms • Library • Food service • Student recreation • Utility &maintenance facilities • Makes efficient use of support services that are not “mission specific” • Testing/assessment • Counseling • Student financial aid • Campus security • Custodial services • Facilities maintenance
Criteria (Continued) • Provides a clear pathway of student progression to point of program completion regardless of point of entry • As a minimum, serves the differing needs of the following sub-populations • Academically well prepared recent high school grads • Recent high school grads with academic deficiencies • Adults • With some college • With high school, no college • Less than high school