Download

1 / 24
240 likes | 482 Vues
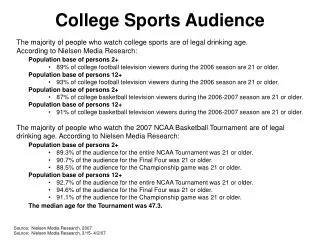
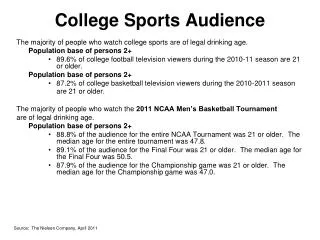
Amateurism and College Sports. In 2005-2006 NCAA game revenue was $500 million – not including football bowl games. 90% of this came from March Madness. Thus 1% of student athletes generated almost all the revenue of the NCAA.

E N D
In 2005-2006 NCAA game revenue was $500 million – not including football bowl games. 90% of this came from March Madness. Thus 1% of student athletes generated almost all the revenue of the NCAA. Colleges and Universities use sports to enhance the prestige of the institutions and to contribute to the bottom line, much like cities do ( as we saw before). Much of the first section of the chapter deals with the history of amateurism in America, and I know you will enjoy that reading.
Character Many say that sports is a way for participants to develop character. Historically this meant enforced religious devotions, but today is more about building courage and initiative, tolerance and persistence.
How to view the NCAA While not mutually exclusive, it can be said the NCAA is 1) A defender of the academic mission of the university (where student athletes are treated like the rest of the student body) 2) Is a subverted market for athletes. In other words, the NCAA is the enforcer in a cartel. Remember – college athletes generate revenue. Competition for players may push up “pay” for players. As long as the MRP > or equal to pay the college makes money by getting the athlete.
Prisoner’s Dilemma Table 11.1 (and next slide) suggests the dilemma colleges face when recruiting. Each school sees that spending heavily is the dominant strategy. So both end up spending a lot and having no real advantage over the other. If neither spent a lot on recruiting again neither would have a real advantage but they wouldn’t spend as much money. This idea is presented with the concept of no NCAA around. So, the NCAA comes in and says you can’t spend heavily on recruiting (really meaning there are many restrictions on what can be done with student athletes).
Darwin U Huxley U spend heavily Spend little Spend heavily no advantage Huxley strong to either Darwin weak Spend little Huxley weak no advantage Darwin strong to either Short of colluding, Huxley sees that no matter what Darwin does, it is better to spend heavily than to spend little (if Darwin spend heavily Huxley is in a weaker position by spending little, and if Darwin spends little Huxley gains by spending heavily). Darwin sees things the same way and thus they both spend heavily.
Rent earned by schools due to NCAA Rent = MRP of an athlete minus what school pays in terms of tuition and fees. Some dude named Brown did some work where he showed schools may have revenues of up to $1 million generated by an athlete, but the school only has to pay the athlete about $30,000 in tuition and room and board and the like. Who gets the excess money? Athletic directors? Coaches? Students in the form of lower tuition?
Cartel • The NCAA is a cartel. A cartel is a group of firms (or countries in the case of OPEC) that cooperate in order to exercise monopoly or monopsony power over a market. What do they cooperate over? They • Fix market price structure instead of letting competition work • -they assign output levels to members • -divide cartel profits • -erect barriers to entry by others. • The authors of the book suggest a cartel of two is like a monopoly that makes its output in two plants. We focus on this multiplant monopoly next.
Multiplant monopoly Each facility or plant has a marginal cost structure where the MC rises as output rises in a plant. The next unit of output of the firm will come from the plant with the lower MC for that unit. Example: say the two plants are identical where MC in each plant is always going up with successive units of output. The first unit of output for the firm will come from “plant1.” The 2nd unit of output for the firm will come from “plant2.” The 3rd unit of output for the firm will come from “plant1.” There is back and forth from plant to plant for units of output.
Multiplant Monopoly Example – say the plants do not have identical MC schedules. The first several units of the firm come from the plant that has lower MC. Then the rest of the units come from each plant with the back and forth nature mentioned when the plants are identical.
Multiplant Monopoly Here we study the situation where a monopoly sells in one market but makes the output in two facilities.
multiplant monopolist The type of monopolist we will consider here is one that produces output in two facilities, but sells the output in one market. The questions we want to answer are: 1) How much output to sell in the market, 2) What price to charge in the market, 3) How much of the total output should come from each of the facilities?
firm level marginal cost Each facility will have a marginal cost schedule. The first unit of output out of each facility will have a MC value, of course. Say the first plant has a MC = 3 for the first unit and plant 2 has a MC = 4 for the first unit. The first unit the firm sells should come form plant 1. Now say the second unit from plant 1 has a MC = 3.5. The second unit the firm sells should come from plant 1 as well. If the third unit from plant 1 has a MC = 4.25, then the third unit the firm should sell should be the first unit from plant 2. In a graph this is accomplished by horizontally adding the plant level MC’s to get the firm level MC.
Firm level marginal cost $ MC firm MC1 MC2 equal The marginal cost of the firm is the horizontal sum of the marginal cost in each plant. I show in math how to make this summation later.
Notice on the previous slide the plant 2 MC is to the right of the plant 1 MC. I have a certain dollar amount shown in the graph. Plant 2 is in a sense is the low cost producer because for MC to reach the level of the dollar amount shown it can add way more units of output than can be achieved in plant 1. Think about Nebraska football recruiting. The first 20 or 30 guys are easy to get. They want to play at Nebraska. What about Sam Houston State? To get that 30th guy is hard. A great deal of time and money would have to be spent to get the guy because the guy probably thinks he can play at Nebraska. SamHS will have to spend a lot to convince the dude.
decision time $ MC firm Pm 2 MC1 MC2 D 1 3 3 MR Q1 Q2 Q = Q1 + Q2 The 1, 2, and 3’s go with the analysis on the next page.
analysis From the previous slide 1) The firm will sell the level of output where firm level MC = MR, 2) charge the price on the demand curve at this level of output, 3) recognize the MR at the optimal Q is a firm level MR now and each plant should produce the amount where MR = MC. Since the firm level MR drives the revenue side of things, don’t sell additional units that have higher MC than MR. Thus plants have MC’s that are equal and also equal to MR.
In general, when the inverse demand is P = A – BQ, the MR is MR = A – 2BQ. Example: Say demand is P = 70 – 0.5Q, then MR = 70 – Q. Note in the example that B = 0.5 and 2B = 2(0.5) = 1. So, this is just a rule you will use in working with a monopoly. You have to put the demand in this inverse form to apply the rule. (If you have demand as Q = a –bP, the rewrite as P = (a/b) – (1/b)Q and thus A = a/b and B = 1/b.)
Decision in Math Terms Say we have demand in inverse form of P = 40 – Q. Plus say the total cost in each plant is (with subscripts) TC1 = Q1 + Q12, TC2 = 4Q2 + 0.5Q22. The MR for the firm is: MR = 40 – 2Q. The MC at each plant is MC1 = 1 + 2Q1, MC2 = 4 + Q2.
Decision in Math Terms There are several ways we could proceed at this time to answer the questions we set out above. I have chosen the path that is consistent with using the graph we saw before. Next you will see a crucial step. Re-express each MC in Q form as MC1 = 1 + 2Q1, as Q1 = .5 MC1 - .5 MC2 = 4 + Q2, as Q2 = MC2 – 4. Now, the Q’s add up to Q and on the right side we add to get Q = 1.5MC – 4.5 (you ignore the subscripts on the MC terms and add them together.)
Output and Price for the Firm Re-express the MC for the firm as MC = (2/3)Q + 3. We have MR = 40 – 2Q. Thus the level of output to maximize profit occurs where MR = MC and we have 40 – 2Q = (2/3)Q + 3, or Q = 37(3/8) = 13.875. The price to charge is on the demand curve P = 40 – 13.875 = 26.125. Note at the optimal level of output the MR = 40 – 27.75 = 12.25.
Production in each plant The MC in each plant, again, is MC1 = 1 + 2Q1, MC2 = 4 + Q2. With MR = 12.25 at the optimal output, set each MC = 12.25 to see how much to make in each plant: Plant 1 1 + 2Q1 = 12.25, or Q1 = 5.625 and Plant 2 4 + Q2 = 12.25, or Q2 = 8.25. Note the two Q’s add up to what we saw before.
Profit The profit for the firm is 258.1875. Find this by looking at the TR and TC in each plant. So in plant 1 TR = PQ = 26.125(5.625) = 146.953125, and TC = Q1 + Q12 = 5.625 + 5.625(5.625) = 37.265625 and profit = 109.6875 In plant 2 TR = 26.125(8.25) = 215.53125, and TC = 4Q2 + .5Q22 = 4(8.25) + .5(8.25)(8.25) = 67.03125 and profit = 148.5. Thus the total profit = 109.6875 + 148.5 = 258.1875
How does all this relate? When you consider the schools that win the most generate the most fan interest and thus revenue, these schools are really the low MC producers and thus they get the bigger share of the market output (see table 11.2).