
fMRI Activation Patterns in Huntington Disease Prediagnosis Saccadic Tasks
This study explores fMRI activation patterns in prediagnostic Huntington disease (HD) patients during saccadic tasks. Results show differences in cortical and subcortical activity between HD and prediagnostic groups. HD manifests with motor, mood, and cognitive abnormalities, with deficits in oculomotor tasks. The fMRI paradigm developed here examines conscious cognitive inhibitory processes in an anti-saccade task, revealing distinct activation patterns. Notably, correct anti-saccade trials elicited greater basal ganglia activation in prediagnostic HD than in HD. This research enhances understanding of HD pathophysiology.

fMRI Activation Patterns in Huntington Disease Prediagnosis Saccadic Tasks
E N D
Presentation Transcript
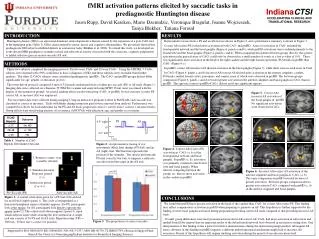
b a p<0.001 k=20 fMRI activation patterns elicited by saccadic tasks in prediagnostic Huntington disease Jason Rupp, David Kareken, Mario Dzemidzic, Veronique Bragulat, Joanne Wojcieszek, Tanya Blekher, Tatiana Foroud IndianaCTSI ACCELERATING CLINICAL AND TRANSLATIONAL RESEARCH b a p<0.001 k=50 Y=6 p<0.001 k=20 Z=2 p<0.001 k=50 X=0 d c p<0.001 k=20 Figure 5. Correct AS> incorrect AS activation of the basal ganglia in preHD. No significant activations were observed in CAG-. d c p<0.005 k=25 Y=6 p<0.001 k=20 Z=2 p<0.001 k=20 Z=2 p<0.005 k=25 X=0 INTRODUCTION RESULTS e Figure 6. Incorrect AS>correct AS activation of the anterior cingulate and basal ganglia in CAG- (a, b). The same comparison in preHD revealed no areas of greater activation. Between-groups comparison shows greater activation in CAG- compared with preHD (c, d) in the anterior cingulate and basal ganglia. Huntington disease (HD) is an autosomal dominant, neurodegenerative disease caused by the expansion of a poly-CAG tract in the huntingtin gene (Table 1). HD is characterized by motor, mood, and cognitive abnormalities. We previously showed that prediagnostic HD subjects exhibited deficits in oculomotor tasks (Blekher et al, 2006). To extend this work, we developed an event-driven fMRI paradigm to examine cortical and subcortical activity associated with the conscious, cognitive preparation to inhibit reflexive gaze in an anti-saccade (AS task. Representative traces from a PS and an AS trial are shown in Figure 2, and a performance summary is shown in Figure 3. Correct AS>correct PS evoked more activation in both CAG- and preHD. Areas of activation in CAG- included the frontoparietal network and the basal ganglia (Figure 4, panels a and b), while preHD activations were confined primarily to the frontal lobe and the basal ganglia (Figure 4, panels c and d). When comparing this pattern between groups directly, this greater activation in the parietal areas of CAG- could only be observed in a small number of voxels at a low p-value of 0.01. There was significantly more activation in the head of the right caudate and the right frontal operculum (FO)/insula in preHD than CAG- (Figure 4, e). In preHD, correct AS>incorrect AS showed activation in the basal ganglia (Figure 5), while there were no such areas in CAG. In CAG- (Figure 6, panels a and b) incorrect AS>correct AS elicited more activation in the anterior cingulate, caudate, FO/insula, medial frontal cortex, precuneus, and cuneus, none of which were observed in preHD. The between-groups comparison (Figure 6, panels c and d) revealed greater activation in the anterior cingulate and basal ganglia in CAG- than in preHD. The opposite contrast (preHD>CAG-) did not yield any significant regions. p<0.005 k=20 Z=6 Figure 2. A representative tracing of eye movements (black line) during a PS (left) and an AS (right) trial. The blue line represents the position of the stimulus. The subject performs the PS trial correctly, but fails to suppress a reflexive saccade toward the target in the AS trial. METHODS Thirty-two subjects completed the imaging protocol. Twelve were CAG- and 19 were CAG+. Using the UHDRS, 7 CAG+ subjects were deemed with ≥99% confidence to have a diagnosis of HD, and these subjects were excluded from further analysis. The other 12 CAG+ subjects were considered prediagnostic (preHD). The CAG- and preHD groups did not differ significantly for age, gender, or education (p>0.2). The event-driven protocol comprised 4 runs of 32 pseudo-randomized trials of either pro-saccade (PS) or AS trials (Figure 1). Imaging data were collected on a Siemens 3T TIM-Trio scanner and analyzed using SPM5. Event onset was timed with the display of the instruction prompt. A factorial random effects model with group (CAG- or preHD) by trial outcome (correct PS, correct AS, or incorrect AS) was employed. Eye movement data were collected during imaging. Using an interactive program written in MATLAB, each saccade was classified as correct or incorrect. Trials with blinks during instruction period were removed from analysis. Performance was computed as follows for each individual for the PS and AS trials: proportion correct = correct trials / (correct + incorrect trials). Group effects were tested using analysis of covariance (ANCOVA) with education, age, and gender as covariates. PS AS 4.5° right 3. Return to center; wait (variable, jittered) 0° 4.5° left 2. Stimulus duration/ Response period (1 s) 3 sec Table 1. Number of CAG Repeats Determines Outcome 1. Instruction period (2 or 4 s) Figure 4. Correct AS>Correct PS activation in CAG- (a, b) of the frontoparietal network and basal ganglia. In preHD (c, d), activation was primarily confined to the frontal lobe and basal ganglia. When directly comparing between the groups (e), there is more activation in the caudate in preHD. p=0.003 Pro-Saccade (PS) Anti-saccade (AS) A Figure 1. A central circle turns green for a PS trial (left) and red for an AS trial (right) (panel 1). The circle is extinguished as a horizontal peripheral square (stimulus) appears. For PS, participants look at the square; for AS, participants look directly opposite the square (panel 2). The central circle then reappears (panel 3), upon which subjects fixate while awaiting the next instruction. A single task run consists of 16 PS and 16 AS trials. Repetition time (TR) = 2000 ms. Yellow star = correct eye position. CONCLUSIONS We found that preHD have greater activation in the head of the caudate than CAG- for correct AS>correct PS. This finding may reflect compensatory activation in preHD when preparing to generate an AS. This hypothesis is further supported by the finding of more basal ganglia activation during preparation preceding correct AS trials compared to that preceding incorrect AS trials. Overall, group differences were most pronounced in incorrect AS>correct AS. CAG- had more activation in subcortical and medial frontal lobe regions that are important nodes of the default mode network best observed in an inactive resting state. One interpretation of this finding is that a period of relative inattentiveness during the instruction prompt predicts subsequent AS errors. Absence of this finding in preHD suggests a different underlying neural mechanism might lead to incorrect AS execution. Pursuit of this hypothesis will require studying activation during the period of saccade execution itself. Figure 3. The proportions of correct saccades. Supported by R01 NS042659, R21 NS060205, N01-NS-3-2357, MO1 RR-00750, TL1RR025759 a Research Support Fund Grant & the Center for Neuroimaging/Indiana Institute for Biomedical Imaging Sciences


