Download

1 / 27
270 likes | 338 Vues
Learn how Origin-Destination surveys are crucial for transportation planning and operations. Explore GIS tools used by agencies like MTA Bridges & Tunnels and WFRC for insightful data analysis.

E N D
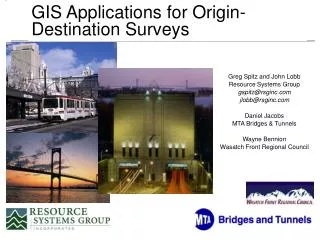
GIS Applications for Origin-Destination Surveys Greg Spitz and John Lobb Resource Systems Group gspitz@rsginc.com jlobb@rsginc.com Daniel Jacobs MTA Bridges & Tunnels Wayne Bennion Wasatch Front Regional Council
Origin-Destination (OD) Data • Critical basis of knowledge for transportation operations, modeling, and future planning • Essential for all transportation modes • Often collected by DOTs and transit agencies, but not (yet) often analyzed with GIS • OD data are inherently spatial, and visualization is key to understand them, thus the need for GIS
Origin & Destination Surveys • Provide insights to: • Who the customers are • Why customers are traveling • How long they are traveling, and • Where they are traveling, etc. • Labor intensive data collection efforts • Used to understand current demand and plan for future demand • Critical data for calibrating travel models
GIS Tools in action • MTA Bridges and Tunnels— largest toll agency in US • Wasatch Front Regional Council &Utah Transit Authority— transit on-board survey • Two different agencies, modes, and application purposes • GIS the common denominator to solve issues for these different purposes
2004 MTA B&T Origin & Destination Survey • Conducted roughly every 8-10 years • 2004 Study: • 304,000 surveys distributed in CASH lanes • 329,000 surveys mailed to E-ZPass customers • Control Data collected in both CASH and E-ZPass lanes with Pocket-PCs • E-ZPass sample from B&T, PANYNJ, NYSTA, NYSBA, and NJRSC comprising 99% of all transactions • Survey period 6AM to Midnight; Weekday, Saturday, and Sunday
MTA B&T Survey TAZ Structure • All zones are based on zip codes • Geocoding of survey data only necessary to the zip code level • Aggregations of zones used to form “super zones”
GIS using static maps • Static analysis with better presentation • Easy to put together quickly • Becoming more and more typical
All O-D pairs with greater than 4% of traffic • All payment types • Weekday • Truck/taxi trips excluded • 6am to Midnight • Total Auto Traffic (6AM to Midnight) is 47,030 • 95% Confidence interval for these OD pairs is plus or minus 2.0% 10.2% 10.2% 19.1% 4.5% 20.2% 4.1% Example of Static Map using super zones:Bronx-Whitestone Bridge – Bronx Bound
GIS Tool Purpose • Take geospatial data and make it easier to visualize, analyze, and interpret • Allow more in depth analyses beyond static reports • Make the tool easy to use, so even a (skilled) monkey can use it • Leverage GIS experts’ skills without taking too much of their time
How was the tool made? • ArcMap extension • Access DB backend • Currently developed to be a stand alone tool (could be made to be network/web enabled) • Simple user interface created using VB development environment
2006 WFRC On-Board Transit Survey • 3 surveys conducted in last 15 years • Data primarily used for travel model development and forecast refinement • 2006 survey • Surveyed riders on 90 bus routes and the TRAX rail system • Collected 5,600 surveys
OD Data Mining is Cumbersome • Survey database has over 100 columns and 5600 rows (difficult to view all relevant variables at once) • TAZ number and/or address text may not be immediately recognizable (data is spatial)
GIS Tool Purpose (WFRC) • Preliminary review of the data suggested that the 2006 survey transfer rates were unreasonable • Interest in examining individual survey records efficiently
Goals Local QA/QC Efficiently examine each record Easy data editing/entry Gain confidence in the data used for model calibration (e.g. transfer rates) Features Custom ArcGIS application Visualize transit path details for one record at a time Routes Origin/Destination Boarding/Alighting Data viewing/editing window GIS tool (WFRC)
Screen capture of GIS Tool Reported data
Survey Errors Identified • People reported multiple paths they sometimes take, rather than simply their current path (question 7) • Inconsistency between routes and OD pair • Geocoding errors • Illogical route sequence
Summary • Application clearly identified obvious inconsistencies and errors, resulting in a more reliable database. • Visualization of these records would also be extremely helpful in assessing survey design and reducing respondent error.
User-friendly GIS tools developed for planners and analysts • GIS tools allow planners and others to drill down on the data • Tool interface confines the problem (both a good and bad thing) • Interface makes analysis much easier and doesn’t require in-depth software/data knowledge • Tools allow analysts to get more out of their data collection investment
Questions ? • Please use the Microphone.