RNA Quality Check Using Experion System for Microarray Studies
This analysis showcases RNA quality of 12 samples for microarray studies, evaluating RQI scores & gene expression intensities at different time points. Multiple regression analysis and identification of Polo-Like Kinase and ATM signaling pathways.

RNA Quality Check Using Experion System for Microarray Studies
E N D
Presentation Transcript
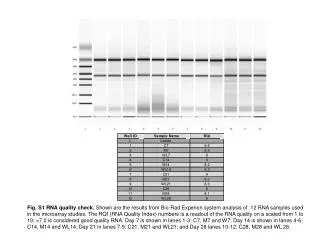
Fig. S1 RNA quality check. Shown are the results from Bio-Rad Experion system analysis of 12 RNA samples used in the microarray studies. The RQI(RNA Quality Index) numbers is a readout of the RNA quality on a scaled from 1 to 10; >7.0 is considered good quality RNA. Day 7 is shown in lanes 1-3: C7, M7 and W7; Day 14 is shown in lanes 4-6: C14, M14 and WL14; Day 21 in lanes 7-9: C21, M21 and WL21; and Day 28 lanes 10-12: C28, M28 and WL 28.
14 12 10 8 6 Gene Expression Intensities 4 7 14 21 28 Days Fig. S4A Multiple regression analysis. After the expression data was normalized by MBCB, a multiple regression algorithm analysis was completed to study chip-chip variation among replicates. High correlation was observed at each time point for the three microarray chips investigated with average R2 values=0.99.
Mitotic Roles of Polo-Like Kinase Fig. S5C Mitotic Roles of Polo-Like Kinasaesignaling pathway. This pathway was identified by IPA for profile-2 genes. The shaded symbols represent gene hits with >1.5-fold change by microarray analysis; clear symbols represent other genes in the pathway (squares=cytokines, oval shape=transcription factors and triangle shape=kinases).
ATM Signaling Nucleus Fig. S5D ATM signaling pathway. This pathway was identified among others for profile-3 genes. The shaded symbols represent gene hits with >1.5-fold change by microarray analysis; clear symbols represent other genes in the pathway (squares=cytokines, oval shape=transcription factors and triangle shape=kinases).