Download
1 / 7
70 likes | 219 Vues
How are statistics used … (a) to compare different groups and (b) to compare single individuals within any group?. Descriptive statistics for groups : Measures of c entral tendency Mean, Median and Mode Measures of variability Variance and Standard Deviation

E N D
How are statistics used … (a) to compare different groups and (b) to compare single individuals within any group? • Descriptive statistics for groups: • Measures of central tendency • Mean, Median and Mode • Measures of variability • Variance and Standard Deviation • Descriptive statistics for single scores: • Percentile rank and Z score
Mode of X = 45 Median of X = 49.5 A set of scores, X (N=20): 58 45 23 71 49 36 61 41 37 75 91 54 43 17 63 73 31 50 45 57 The same set of scores in rank order: 17 23 31 36 37 41 43 45 45 49 50 54 57 58 61 63 71 73 75 91
5 4 Frequency 3 2 1 0-9 10-19 20-29 30-39 40-49 80-89 90-99 50-59 60-69 70-79 100-109 Score (X) in intervals of 10 (Grouped) Frequency Distribution of X: Freq. 0 1 1 3 5 4 2 3 0 1 Interval 0 – 9 10 -19 20-29 30-39 40-49 50-59 60-69 70-79 80-89 90-99
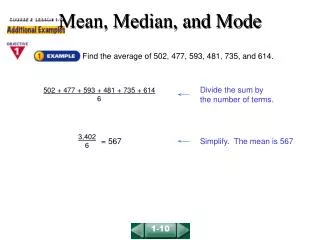
1. Definition of the Mean (M): 2. Definitions of S2, called the variance or V, and S, called the standard deviation or SD:
. . (57 - 51) X X - M (X - M)2 1. 58 2. 45 3. 23 4. 71 . . 20. 57 (58 - 51) (58 - 51)2 = 49 (45 - 51)2 = 36 (45 - 51) (23 - 51) (23 - 51)2 = 784 (71 - 51) (71 - 51)2 = 400 . . (57 - 51)2 = 36 X = 1020 (X - M) = 0 (X - M)2 = 6400
Percentile rank (for a particular raw score): ...the percentage of all scores at or below that score. Recipe: 1. Count the number of scores at or below its value. 2.Divide by the total number of the scores. 3. Multiply this result by 100. For example in the illustrated data set, what is the percentile rank of the raw score, 23? So “23” is at the 10th percentile.
For any score, X, For example in the illustrated data set, the raw score, 23, has the following Z score: Z score (for a particular raw score): ...the distance of that score from the mean, in units of “standard deviations.” Recipe: So “23” is 1.57 standard deviation units belowthe mean.