Download

1 / 19
260 likes | 591 Vues
Quantification of RNA by real-time PCR. Vilborg Matre. Overview. Real-time PCR. Gene expression profile - to characterize how a cell/animal responds to a stimulus. Replaces Northerns. Conventional PCR. One cycle. Denaturation. = a cyclic process leading to exponential

E N D
Quantification of RNA by real-time PCR Vilborg Matre
Overview Real-time PCR Gene expression profile - to characterize how a cell/animal responds to a stimulus Replaces Northerns
Conventional PCR One cycle Denaturation = a cyclic process leading to exponential accumulation of a specific DNA - small amounts of DNA can be detected - Nobel priced method 94oC 72oC Elongation 55oC Annealing time
Conventional PCR versus real-time PCR Conventional PCR - end-point method - detection after PCR Real-time PCR - continuous measurement - log-phase quantitation
Conventional PCR versus real-time PCR log-phase analysis end-point analysis N • high concentration / • high efficiency • high concentration / • low efficiency • low concentration / • high efficiency N : number of amplified molecules n : number of amplification cycles n
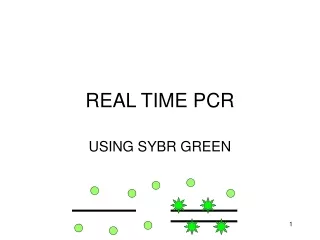
Fluorescence - the clue to real-time PCR Fluorescence!
Detection of PCR-product while formed via fluorescense Alternative I: SYBR-green measuring accumulated total DNA Alternative II: Hybridization-probes measuring accumulated specific DNA
Curve N exponential n Theoretical aspects PCR-basis: N = N0 x 2n • N: number of amplified molecules • N0: initial number of molecules • n: number of amplification cycles
Theoretical aspects Log-transformation: a linear curve for each reaction Formula Log N linear Log N = log N0 + n log2 Starting amount n The accumulation of PCR product can be fully described by this linear curve, and only two points are necessary to describe it
PCR Quantification Theoretical and practical aspects N = N0 x 2n log-phase-PCR Theory N = N0 x (Econst)n Real end-point-PCR N = N0 x (Evar)n N: number of amplified molecules n: number of amplification cycles N0: initial number of molecules E: amplification efficiency
Unknown Sample Standard Curve Automatic quantification by the Lightcycler Target log (F2/F1) CrossingPoint(Cycles) log (F2/F1) log(copynumber) n
Housekeeping gene Target log (F2/F1) log (F2/F1) n n Crossing Point (Cycles) log (F2/F1) log (copy number) n Quantification: Concept for the LightCycler Unknown Sample Standard Curve
Fluorescence detection- an example N = N0 x En with E = 1.9 Fluorescence detected when N = 1010 copies! Cycle n = 14 N0=106
Fluorescence detection- an example N = N0 x En with E = 1.9 Fluorescence detected when N = 1010 copies! Cycle n = 25 Cycle n = 36 N0=103 N0=1
LightCyclerQuantification - what it looks like Standard Calculated concentration 1.0E+10 1.0E+9 1.0E+8 1.0E+7 1.0E+6 1.0E+5 1.0E+4 1.0E+3 1.0E+2 1.0E+1 H2O 1.0E+10 1.0E+9 1.0E+8 1.0E+7 1.0E+6 1.0E+5 1.0E+4 1.0E+3 1.0E+2 1.0E+1 H2O 1.0E+10 1.0E+9 1.0E+8 1.0E+7 1.0E+6 1.0E+5 1.0E+4 1.0E+3 1.0E+2 1.0E+1 H2O 9.522E+9 1.024E+9 9.433E+7 1.127E+7 1.029E+6 9.902E+4 1.021E+4 9.217E+2 9.276E+1 1.085E+1 H2O 1.0E+10 1.0E+9 1.0E+8 1.0E+7 1.0E+6 1.0E+5 1.0E+4 1.0E+3 1.0E+2 1.0E+1 Template: Plasmid; Target: CycA; Detection Format: Hybridization Probes
Interpretations of the results • Evaluation Parameters • Error < 1 • r = -1.00 • Slope • Melting curve analysis • Primer dimers • Expected melting point • Calculations E = 10 -1/slope E = 10 -1/-3.407 = 1.97 293Tet-Off/Dox+/AMV= 0.0351 293Tet-Off/Dox+/PP1 293Tet-Off/Dox-/AMV= 0.1907 293Tet-Off/Dox-/PP1 5.4 fold up
Another experiment • Evaluation Parameters • Error = 0.142 • r = - 1.00 • Slope • Melting curve analysis • Primer dimers • Expected melting point • Calculations E = 10 -1/slope E = 10 -1/-3.475 = 1.94 293Tet-Off/Dox+/AMV= 0.0168 293Tet-Off/Dox+/PP1 293Tet-Off/Dox-/AMV= 0.0871 293Tet-Off/Dox-/PP1 5.2 fold up
Additional informationMelting curve analysis • AFTER amplification - the Lightcycler can perform a second type of analysis: precise determination of the melting point (Tm) of the product • Procedure • After the PCR run the temperature is slowly raised while the fluorescence is measured. As soon as the dsDNA starts to denature, the SYBR green dye is released, resulting in decrease in fluorescence.
Benefits ofMelting curve analysis • Confirmation of PCR product identity • Each product has its specific Tm • One peak - one product, several peaks - many products • Differentiation of specific PCR product from non-specific products • such as primer dimers