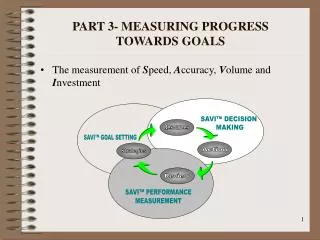
PART 3- MEASURING PROGRESS TOWARDS GOALS
SAVI™ DECISION MAKING. SAVI™ GOAL SETTING. SAVI™ PERFORMANCE MEASUREMENT. Strategies. Resources. Action. Review. PART 3- MEASURING PROGRESS TOWARDS GOALS. The measurement of S peed, A ccuracy, V olume and I nvestment. Introduction.

PART 3- MEASURING PROGRESS TOWARDS GOALS
E N D
Presentation Transcript
SAVI™ DECISION MAKING SAVI™ GOAL SETTING SAVI™ PERFORMANCE MEASUREMENT Strategies Resources Action Review PART 3- MEASURING PROGRESS TOWARDS GOALS • The measurement of Speed, Accuracy, Volume and Investment
Introduction • Performance measurement is the most neglected and yet critically important element of the management cycle. • Now in section 3, we will do two things, we will learn how to measure progress, and we will learn how to motivate progress. • Measuring progress is a scientific model of capturing change in performance areas that are desirable.
Vision, Mission and Values Long-Term View of Success What is Desired? Defining Challenges and Opportunities Examining the Company Profile Defining the Industry Situation Phase 1 What is Possible? Define Critical Success Factors Make a choice of Long and Short-Range Strategies Build an action plan of what needs to be done to make this happen, in the short and long run Make Resource Allocation Decisions Phases 2&3 Feedback results to the process Develop a Performance Management System Phase 4 CHAPTER 10, PERFORMANCE MEASUREMENT AND PERFORMANCE MANAGEMENT • Things could be worse, suppose your errors were counted and recorded every day like a baseball player
Operating plans and budgets Project management Needs Assessment Performance Measurement Strategies Resources Action Review Introduction to Chapter 10 • Figure 10.1, The Management Cycle
LINKING PERFORMANCE MEASUREMENT TO STRATEGIC PLANS • WHY IS MEASUREMENT NECESSARY? • To show progress towards achieving strategic goals. • Show evidence as to the performance gaps in areas where strategic outcomes are not being met • Show evidence to let superior performance be recognized and rewarded. • Show evidence to let poor performance be recognized and corrected.
AN OVERVIEW OF PERFORMANCE MANAGEMENT • Figure 10.2, levels of performance management Strategic vision Directors View Management View Core Strategies FEEDBACK Operations View Action Plans Satisfaction
Operating Goals High level Goals Strategic Vision Satisfaction Figure 10.3, An Overview Of Performance Measurement
Building a Measurement System • The first effort in performance measurement will be to develop measures of results and outcomes • we can then translate the strategic goal into an operating goal,
Building a Measurement System • two principal dimensions. • We need to measure activity • Hour spent, materials consumed, overhead used. • We need to measure results and outcomes. • Things built, customers satisfied, money made
Financial Efficiency • Sustainability in the economic system • Stewardship of the natural environment • Safety of employees and the public • Satisfaction of customers Strategic Goals High Level SAVI™ Measures for each of the strategic goals Operating Activity and Projects for Improvement INPUT MEASURES Materials, labour, overhead, time and talent etc. Measures of resources used to track the efficiency of the utilization of resources OUTPUT MEASURES Investment Returns Customer Satisfaction Social and Other Benefits. Measures of the effectiveness of the use of resources • Figure 10.4, • Input and Output Measures
OUTPUT MEASURES CATEGORY MEASUREMENT CONCEPT MOST FREQUENTLY USED SOURCES OF INFORMATION Investment Returns Financial Returns Total profits and % rate of return on investment Financial Efficiency Budget and actual cost information supplied by financial services is equated to the volume of work done using “unit measure” concepts Customer Satisfaction Internal customers, (intermediate results such as on scope, on time, on budget) Data mining internal information about effectiveness at the intermediate level External customers (public perceptions of value, quality, function etc.) Opinion survey of external users which captures their perception of the value of the program Social Benefits Non-financial social returns that are not being measured in the satisfaction category. (Environmental impact, value of recreation to the health care system etc) “Data Mining” existing information within the organization and among comparable organizations from outside Figure 10.5, Example Output Measures
INPUT MEASURES CATEGORY MEASUREMENT CONCEPT MOST FREQUENTLY USED SOURCES OF INFORMATION Financial Operating Resources Materials and labour Direct tracing of materials and labour consumed to the performance area using the financial system Overhead Allocation of overheads using an accounting allocation method that reflects the use of overheads by the performance area. Financial Capital Resources Capital investment in operating assets The accounting system will break out the capital investments in each performance area Other organizational resources Non-financial resources consumed by the performance area Management estimates of the resources of talent and energy and other non-financial resources that have been dedicated to this performance area. Figure 10.6, Example Input Measures
Two Kinds of Data • Measures that come from observations of events are called “Counting” measures, • Measures of opinion are called “Judgement” measures.
Developing SAVI™ measures • Regardless of whether you are developing input or results measures, and regardless of whether you are developing high level measures for directors or operating level measures…..there is one framework for the development of the performance measures.
Satisfaction and Value are Inevitable Figure 10.7, Four Dimensions of Measurement Do what you do at the right speed. “Speed” means on time, not fast! Speed tm Do what you do with accuracy. This is the quality dimension of your work Accuracy Do what you do in the right volume. You need to meet the needs of all of your customers. Volume Soundly manage investment in resources, in terms of efficient and effective allocation of money, assets and people. Investment
Four Dimensions of Measurement • Speed • Speed, an output measure, refers to the timing of the delivery of the product or service, not necessarily ‘how fast’.. • Accuracy • Accuracy, an output measure, is the quality dimension of your results. • Volume • Volume, an output measure, refers to the quantity of goods and services provided. • Investment • Investment, an input measure, refers to the efficient utilization of total organizational resources to get the job done.
The Bus Ride. • Riders on a bus will be happy when the bus arrives on time S, it is clean and the driver is safe A, everyone at the bus stop is picked up V, and the fare is fair I. If any one of the dimensions is out of line, satisfaction declines.
The Budget Process. • Internal customers, senior management, will be happy when the deadline is met S, the budgets are accurate A, all divisions have prepared the budget V, and there was a minimum investment made I in preparing the budget because the process was simple.
The Restaurant. • Customers will be happy when the service is prompt S, (fast at the drive through, slow at the romantic restaurant), the food is good quality A, the portion was the right size V and the price was fair I.
The Grocery Store. • Customers are happy when the store is open at convenient times S, the goods are fresh A, there is enough selection of products V and prices are low I.
The Car Dealership. • Customers are happy when the model they want is available immediately S, it is clean on delivery A, it is reliable for the first five years V, and the price was fair I.
Chapter Summary • In order to effectively manage performance we need to have good measures of performance. To have good measures we need the commitment of the organization to make improving performance a high priority, and a ‘safe’ thing to do.
Good performance measures should be: • Measurable • The data management system must be able to locate and report performance information in an accurate and timely fashion. • Observable • There is a cause and effect relationship between data reported and desired performance such that when the data shows improvement, performance has actually improved. • Reliable • The goal and its measurement system should offer consistent and uniform reporting. • Controllable • The variables that cause change in a performance area must be in the manager's control. • Active • The goal must relate to an active business process that is in the realm of the manager's routine.
Closing Remarks • This chapter introduced the concepts of measurement, chapter 11 will present performance measurement examples in detail (this should make us ‘able’ to do it), and chapter 12 will cover the human side of measuring and managing performance, (this should make us willing to do it).