Trends in Direct Payments Usage in England (2001-2005)
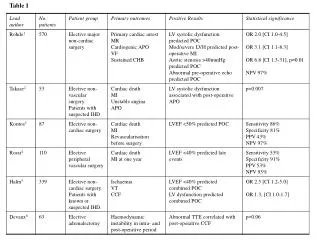
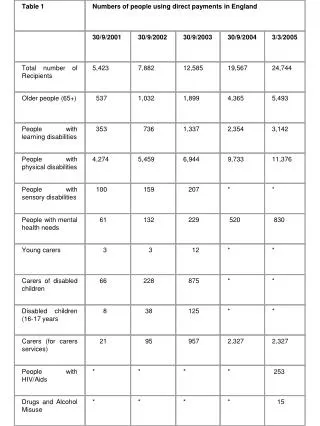
This table presents the number of people using direct payments in England from September 30, 2001, to March 3, 2005. The total number of recipients increased significantly from 5,423 in September 2001 to 24,744 by March 2005. Specific groups such as older people, individuals with learning and physical disabilities, and young carers are highlighted, showcasing notable growth in direct payment uptake. This data underscores the increasing reliance on direct payments to support various social care needs across different demographics.

Trends in Direct Payments Usage in England (2001-2005)
E N D
Presentation Transcript
Table 1 Numbers of people using direct payments in England 30/9/2001 30/9/2002 30/9/2003 30/9/2004 3/3/2005 Total number of Recipients 5,423 7,882 12,585 19,567 24,744 Older people (65+) 537 1,032 1,899 4,365 5,493 People with learning disabilities 353 736 1,337 2,354 3,142 People with physical disabilities 4,274 5,459 6,944 9,733 11,376 People with sensory disabilities 100 159 207 * * People with mental health needs 61 132 229 520 830 Young carers 3 3 12 * * Carers of disabled children 66 228 875 * * Disabled children (16-17 years 8 38 125 * * Carers (for carers services) 21 95 957 2,327 2,327 People with HIV/Aids * * * * 253 Drugs and Alcohol Misuse * * * * 15