Comparative Analysis of Pain and Suffering Awards in European Nations
This study compares pain and suffering awards across 19 European nations by injury type and award amount, providing insights into vertical and horizontal equity. Data also includes U.S. case studies for comparison.

Comparative Analysis of Pain and Suffering Awards in European Nations
E N D
Presentation Transcript
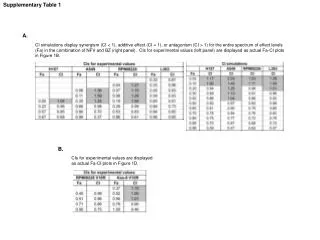
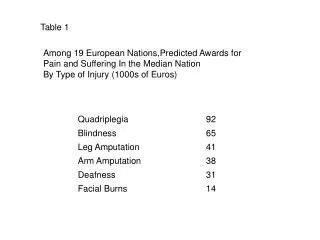
Table 1 Among 19 European Nations,Predicted Awards for Pain and Suffering In the Median Nation By Type of Injury (1000s of Euros)
Table 2 National Award Proportion For Each Injury as a % of Highest Predicted for Each Nation
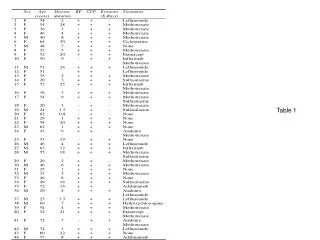
Table 6 National Rankings (1 to 19) by Amount of Award by Injury Type and Overall Average
Table 7 European “Horizontal Equity” Among the 19 Nations, Median Nation and Range of National Awards for Pain and Suffering by Type of Injury (in 1000s of Euros)
Table 8 19 Nation Data: Pain and Suffering Awards by Type of Injury
Table 9 U.S. “Horizontal Equity”: Pain and Suffering Awards in 12 Quadriplegia Cases (in $ millions)
Above the Knee: .400, 4.0, 5.6, 7.5 Both Legs: .150, 6.0 One Leg Below the Knee: .150, .200, .400, .490, .500, .615, 1.000, 1.550, 1.750, 5.580 9.750 Table 10 U.S. “Horizontal Equity” Pain and Suffering Awards in 17 Leg Amputation Cases (in $ millions)
Table11 U.S. “Horizontal Equity” • Both eyes: 4.4, 4.5, 5.0 • One eye: .245, .300, .300. .500, .500, .800, 1.5, 5.6 Pain and Suffering Awards in 11 Blindness Cases(in $ millions)
Table 12 U.S. “Horizontal Equity” 7 Finger Loss Cases (P & S in $1000s) 5 Arm Loss Cases (P & S in $1000s)
Table 13 U.S. “Horizontal Equity”U.S. Ratios of Full Range of Pain and Suffering Awards by Type of Injury
Table 14Cross-National Award Size Comparison Comparing U.S. Median Pain and Suffering Awards with European Median and Range
Table 15 Taking Legal Fees Into Account What’s Left for Victim Pain and SufferingU.S. Leg Amputation Awards (in $1000s)
Table 16 Taking Legal Fees Into Account What’s Left For Victim Pain and Suffering U.S. Quadriplegia Awards (in $1000s)
Table 17New South Wales:DisabilitySeverity % andCorrespondingPain and SufferingAward %
Table 18 “Vertical Equity”European Study Hypothetical Injuries Under New South Wales Law
Table 19 U.S. Leg Amputation Awards Adjusting for Legal Fees and a Cap on Pain & Suffering of $250,000 ($1000s)
Table 20 U.S. Quadriplegia Awards Adjusting for Legal Fees and a Cap on Pain & Suffering of $250,000 ($1000s)
Table 21 Examples Comparing the Existing Regime with a Proposed New Regime ($1000s)