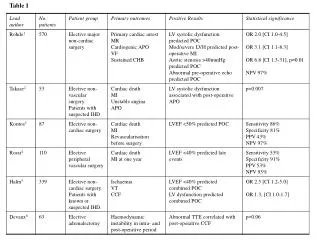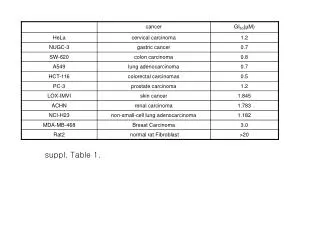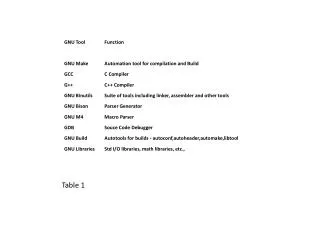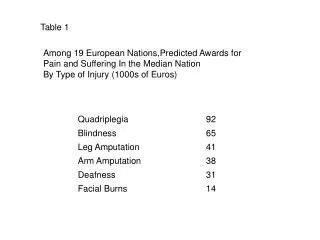
Table 1
Table 1. 116 kDa. 45 kDa. 35 kDa. 25 kDa. 18,8 kDa. 14,4 kDa. A. B. Antigenic targets RA SM. Antigenic targets wrist RA SM. Finger. Wrist. Knee. Hip. Healthy control sera. RA sera. RA serum. RA serum. RA serum. RA serum. Healthy serum. Healthy serum. Healthy serum.
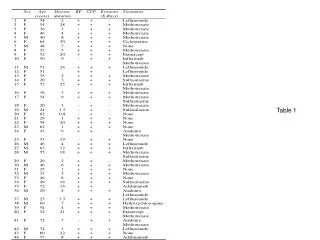

Table 1
E N D
Presentation Transcript
116 kDa 45 kDa 35 kDa 25 kDa 18,8 kDa 14,4 kDa A B Antigenic targets RA SM Antigenic targets wrist RA SM Finger Wrist Knee Hip Healthy control sera RA sera RA serum RA serum RA serum RA serum Healthy serum Healthy serum Healthy serum Healthy serum Secondary Ab Figure 1
Identification of major spots obtained with RA wrist FLS A B RA FLS RA FLS P5 RA FLS P3 RA FLS P4 1 2 3 4 5 1 2 3 4 5 1 2 3 4 5 RA sera RA sera RA sera RA sera Figure 2
2-D map IEF SDS-PAGE Mass (kDa) P18206-2 115 P55072 Q6P707* P11021* 82 P11142 P38646 P02545-2* P07237 P10809* O15460 64 P27797 P50995* P30101 P23381 P78371 O43175 49 P08670 P06733 P60709 P04083* 37 P08758* P07355 P04406 P18669 P67936 P29474 26 P04792 P09211 P30041 P32119 P04179 P30086 P23528 P62937 19 P09382 Q9BRY9 P07737 P05413 15 P31949 Figure 3 pI 3 10
Table 2: Results of MALDI mass spectrometry analysis of 2D-PAGE isolated FLS cellular proteins. The identities of 40 spots are listed.
45 kDa 35 kDa 25 kDa Antigenic targets: RA FLS 116 kDa 67 kDa 18,8 kDa 14,4 kDa Figure 4
A B Coefficient for X axis Western blot strip Antigen Identity Sensitivity p19 0.466 p26 0.605 0.629 p30 p33 0.495 RA FLS p37 0.618 Cutoff = 0,55 Sensitivity = 89 % Specificity= 93% AUC : Figure 5
pI pI 3 3 Mass (kDa) Mass (kDa) IEF IEF SDS-PAGE SDS-PAGE 82 A 82 B P26 P30 64 64 49 P37 49 26 26 19 19 15 15 10 10 C RA serum 2 RA serum 1 P57 Figure 6