
Uploaded by
alanna
1 SLIDES
2060 VUES
390LIKES
Graphing Limiting Reactants
DESCRIPTION
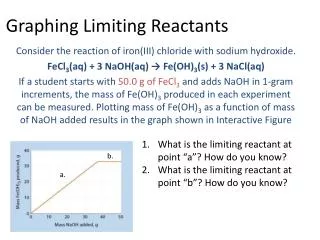
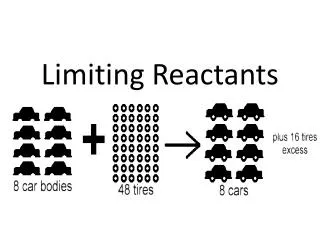
Graphing Limiting Reactants. Consider the reaction of iron(III) chloride with sodium hydroxide. FeCl 3 ( aq ) + 3 NaOH ( aq ) → Fe(OH) 3 (s) + 3 NaCl ( aq )
Download
1 / 1
Download Presentation

Télécharger la présentation
Graphing Limiting Reactants
An Image/Link below is provided (as is) to download presentation
Download Policy: Content on the Website is provided to you AS IS for your information and personal use and may not be sold / licensed / shared on other websites without getting consent from its author.
Content is provided to you AS IS for your information and personal use only.
Download presentation by click this link.
While downloading, if for some reason you are not able to download a presentation, the publisher may have deleted the file from their server.
During download, if you can't get a presentation, the file might be deleted by the publisher.
E N D
Presentation Transcript
Graphing Limiting Reactants Consider the reaction of iron(III) chloride with sodium hydroxide. FeCl3(aq) + 3 NaOH(aq) → Fe(OH)3(s) + 3 NaCl(aq) If a student starts with 50.0 g of FeCl3and adds NaOH in 1-gram increments, the mass of Fe(OH)3 produced in each experiment can be measured. Plotting mass of Fe(OH)3 as a function of mass of NaOH added results in the graph shown in Interactive Figure What is the limiting reactant at point “a”? How do you know? What is the limiting reactant at point “b”? How do you know? b. a.


More Related
Audio
Live Player