Download
1 / 6
60 likes | 236 Vues
A. CFP. YFP. B. CFP. bleach. YFP. C. Sup Fig 1. Sup Fig 2. A. A549. A549. B. R1. R1. R2. R2. R3. R3. R1. R1. R2. R2. R3. R3. kDa. kDa. 57. 58. PDIA3. PDIA1. 46. 46. β Actin. β Actin. + + +. + + +. - - -. - - -. siCrtl siPDIA1.

E N D
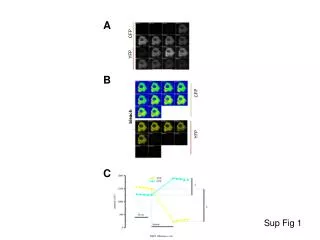
A CFP YFP B CFP bleach YFP C Sup Fig 1
A A549 A549 B R1 R1 R2 R2 R3 R3 R1 R1 R2 R2 R3 R3 kDa kDa 57 58 PDIA3 PDIA1 46 46 βActin βActin + + + + + + - - - - - - siCrtl siPDIA1 siCrtl siPDIA3 - - - - - - + + + + + + R.D. R.D. 1 1 1 1 1 1 0.80 0.20 0.43 0.48 0.48 0.70 D C A549 A549 R1 R1 R2 R2 R3 R3 R1 R1 R2 R2 R3 R3 kDa kDa PDIA4 PDIA4 72 72 PDIA6 PDIA6 48 48 βActin βActin 46 46 + + + + + + - - - - - - siCrtl siPDIA6 siCrtl siPDIA4 - - - - - - + + + + + + R.D. R.D. 1 1 1 1 1 1 0.45 0.10 0.11 0.05 0.16 0.20 Sup Fig 3
A R1 C siCrtl siPDIA4 siPDIA6 100 95 90 85 80 75 70 0 5.5 6 3 NT Cell survival (%) Cell count 7 31 22 / 25µM CDDP 25µM CDDP TMRM (m) B C D R1 siCrtl siPDIA4 siPDIA6 3 5 6 NT Cell count 36 8 24 25µM CDDP Cell count h h SubG1 Caspase 3-7 activity (RFU) Supp Fig 4 25µM CDDP
A2780R 8.5 21 8.3 58 25 13 13 45 63 28 A C siCrtl siPDIA4 siPDIA6 A2780R kDa 72 PDIA4 kDa βActin 48 46 PDIA6 NT βActin siCrtl siPDIA4 46 + - - + Cell count siCrtl siPDIA6 + - - + 53 25µM CDDP TMRM (m) B D A2780R A2780R siCrtl siPDIA4 siPDIA6 siCrtl siPDIA4 siPDIA6 23 1.8 5.15 2.9 6.2 1.6 8.27 NT NT 91.2 90 89 Cell count Annexin-PE(+) 9.0 7.8 8.9 33.90 9.1 67.3 25µM CDDP 25µM CDDP 82.3 56.4 20.8 7AAD(+) SubG1 Sup Fig 5
120 100 80 60 40 20 R1 R2 R3 0 Cell viability(%) Crtl. NT Crtl PDIA4 PDIA6 Crtl. PDIA4 PDIA6 Oxaliplatinum (µM) - - 25 50 25 50 25 50 - - - - - - Carboplatinum (µM) - - - - - - - - 25 50 25 50 25 50 Sup Fig 6