Analysis of Cell Viability and DNA Methylation in HER2 Amplified Cell Lines Over Time
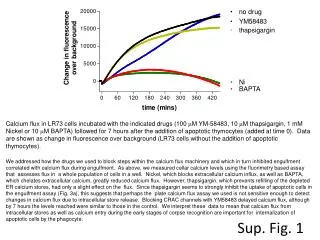
This study investigates cell viability and DNA methylation levels across different cancer cell lines over time, focusing on HER2 amplification's impact. Suppl. Figures illustrate cell growth trends (Sup. Fig. 1), differential methylation at CpG sites (Sup. Fig. 3), and associations with gene expression for key tumor-related genes, including GREM1 and PCDH10. Methylation levels were notably assessed in both cancerous and non-cancerous cells to understand their potential role in tumorigenesis.

Analysis of Cell Viability and DNA Methylation in HER2 Amplified Cell Lines Over Time
E N D
Presentation Transcript
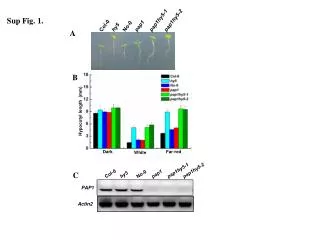
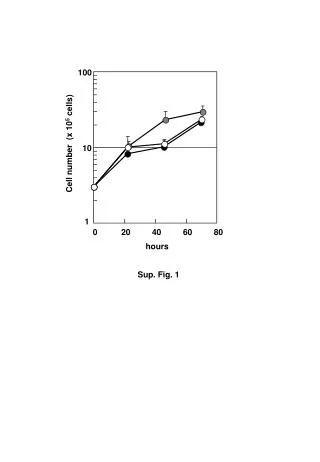
Sup. Fig. 1 100 Cell number (x 105 cells) 10 1 0 20 40 60 80 hours
Sup. Fig. 2 HER2 amplification (+) HER2 amplification (-)
Sup. Fig. 3 CpG site no. CpG site no. 1 2 3 4 5 6 7 8 9 10 11 12 13 14 15 16 17 18 1 2 3 4 5 6 7 8 9 10 11 12 13 14 15 Clone no. Clone no. 1 1 2 2 3 3 3OST2 [Case# 31] FLNc [Case# 10] 4 4 5 5 6 6 7 7 8 8 9 9 10 10 CpG site no. CpG site no. 1 2 3 4 5 6 7 8 9 10 11 12 13 14 15 16 17 18 19 20 21 6 1 2 3 4 5 7 8 9 10 11 12 13 Clone no. Clone no. 1 1 2 2 3 3 GREM1 [Case# 15] THBD [Case# 4] 4 4 5 5 6 6 7 7 8 8 9 9 10 10 11 11 12 12 13 CpG site no. CpG site no. CpG site no. 1 2 3 4 5 6 1 2 3 4 5 6 7 8 9 10 1 2 3 4 5 6 7 8 9 Clone no. Clone no. 1 1 Clone no. 1 2 2 2 3 3 XT3 [Case# 31] LOC346978 [Case# 9] 3 PCDH10 [Case# 22] 4 4 4 5 5 5 6 6 6 7 7 7 8 8 8 9 9 10 10 11 11 12 12 13
Sup. Fig. 4 LOC346978 3OST2 GREM1 80 30 60 60 Methylation level (%) 40 20 40 10 20 20 0 0 0 Ca. Non-ca. Ca. Non-ca. Ca. Non-ca. PCDH10 FLNc XT3 80 40 80 60 30 60 Methylation level (%) 40 20 40 20 10 20 0 0 0 Ca. Non-ca. Ca. Non-ca. Ca. Non-ca. THBD CLDN3 CDKN2A 80 20 40 60 Methylation level (%) 40 20 10 20 0 0 0 Ca. Non-ca. Ca. Non-ca. Ca. Non-ca.