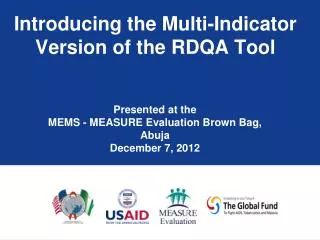
Introducing the Multi-Indicator Version of the RDQA Tool
380 likes | 959 Vues
Introducing the Multi-Indicator Version of the RDQA Tool. Presented at the MEMS - MEASURE Evaluation Brown Bag, Abuja December 7, 2012. Background - 1. National programs and donor-funded projects are working towards achieving ambitious goals in the fight against HIV, TB and malaria.

Introducing the Multi-Indicator Version of the RDQA Tool
E N D
Presentation Transcript
Introducing the Multi-Indicator Version of the RDQA Tool Presented at the MEMS - MEASURE Evaluation Brown Bag, Abuja December 7, 2012
Background - 1 • National programs and donor-funded projects are working towards achieving ambitious goals in the fight against HIV, TB and malaria. • Measuring success and improving management of these initiatives are based on strong M&E system that produce quality data regarding program implementation. • As a result of strategies like “Three Ones”, the “Stop TB Strategy” and the “RBM Global Strategic Plan”, a multi-partner project* was launched in mid-2006 to develop a joint Routine Data Quality Assessment (RDQA) Tool. • The objective of this initiative was to provide a common approach for assessing and improving data quality (between partners and with National Programs). * Partners most directly involved include PEPFAR, USAID, WHO, Stop TB, the Global Fund and MEASURE Evaluation.
Background - 2 • Importantly, funding is tied to performance and need to show effectiveness of interventions • Hence, the need for quality data is imperative to show program effectiveness • Interestingly, single indicator-RDQA tool was used for Joint national DQA exercises in 2008, 2009, 2011 and 2012 (led by NACA) • Multi-indicator tool has never been used in the country and there is a need to sensitize M&E professionals of the potential opportunities in this tool • This tool provides opportunity to evaluate data quality for selected priority indicators in different program areas at the same time and identify areas for improvement
Countries where RDQA has been used or is currently being implemented • Kenya • Tanzania • South Africa, Lesotho, Swaziland • Nigeria • Cote d’Ivoire • DRC • Haiti • Mozambique • India • Botswana • Global Fund On Site Data Verification (OSDV) by LFAs in many countries
Data Quality • Refers to the worth/accuracy of the information collected & focuses on ensuring that the process of data capturing, verifying and analysis is of a high standard. • RDQA tools facilitate this process and also provide opportunity for capacity building
Why Data Quality is Important - I • Mistake should be prevented rather than detected • Correcting data that has been wrongly recorded is difficult and expensive • The qualityof the data is largely determined by how well the data are collected and forms are completed • In the presence of errors, data cannot be interpreted – useless! • Increased Data Quality Increased reliability and usability
Why Data Quality is Important - II • Program planning • Data use • Program decision making • Sharing program information • Reporting/Accountability
Data Quality Assurance • Data Quality Assessment involve checking data against several criteria/dimensions • Validity • Integrity • Reliability • Timeliness • Completeness • Precision • Confidentiality • DQA tool is used to assess the quality of the data and should be responsive to meeting the seven dimensions • Assessment helps us to determine areas of poor data quality & help come up with action plans for potential solutions.
Objectives of RDQA • VERIFY the quality of reported data for key indicators at selected sites • ASSESS the ability of data-management systems to collect, manage and report quality data. • IMPLEMENT measures with appropriate action plans for strengthening the data management and reporting system and improving data quality. • MONITOR capacity improvements and performance of the data management and reporting system to produce quality data.
Uses of RDQA • Routine data quality checks as part of on-going supervision • Initial and follow-up assessments of data management and reporting systems – measure performance improvement over time • Strengthening program staff’s capacity in data management and reporting • External assessment by partners and other stakeholders
M&E Unit Intermediate Aggregation Levels (e.g. LGAs, States) Service Points Conceptual Framework of DQA Generally, the quality of reported data is dependent on the underlying data management and reporting systems; stronger systems should produce better quality data. Dimensions of Quality QUALITY DATA Accuracy, Completeness, Reliability, Timeliness, Confidentiality, Precision, Integrity Functional Components of a Data Management System Needed to Ensure Data Quality Data-Management and Reporting System I M&E Structure, Functions and Capabilities II Indicator Definitions and Reporting Guidelines III Data-collection and Reporting Forms / Tools REPORTING LEVELS IV Data Management Processes V Links with National Reporting System VI Data management processes 11 VII Data quality mechanisms and controls VIII Links with the national reporting system
RDQA Methodology: Chronology and Steps PHASE 1 PHASE 2 PHASE 3 PHASE 4 PREPARATION IMPLEMENTATION ACTION PLAN FOLLOW UP • 1. Determine scope of the DQA • 4. Assess data management system • 6. Summarize findings and prepare action plan • 7. Implement activities and follow up 2. Determine indicators, data sources and time period • 5. Verify data • 3. Determine and notify facilities/sites Implementation is conducted at M&E Unit, service sites and intermediate aggregation levels, as appropriate, given the scope of the DQA
1 Data Verifications (Protocol 1) Quantitative comparison of recounted to reported data and review of timeliness, completeness and availability of reports. 2 Assessment of Data Management Systems (Protocol 2) Qualitative assessment of the strengths and weaknesses of the data-collection and reporting system. RDQA Methodology: Protocols • The methodology for the DQA includes two (2) protocols:
RDQA Methodology: Protocols • Data Verification • Documentation Review • Recounted results – trace and verify • Cross checks – compare with alternative data sources • Reporting Performance • Timeliness, completeness, availability (Intermediate level and higher) • System Assessment • Are elements in place to ensure quality reporting?
RDQA Methodology: Data Verification Component Service Delivery Sites / Organizations Intermediate Aggregation levels (eg. District, Region) M&E Management Unit Trace and verify Indicator Data Trace and Verify Reported Results • PURPOSE: Assess on a limited scale if Service Delivery Points and Intermediate Aggregation Sites are collecting and reporting data accurately and on time. • The data verification step takes place in two stages: • In-depth verifications at the Service Delivery Points; and • Follow-up verifications at the Intermediate Aggregation Levels (Districts, Regions) and at the M&E Unit.
M&E Unit/National Monthly Report TOTAL 435 District 2 District 3 District 1 Monthly Report Monthly Report Monthly Report District 4 Monthly Report SDS 3 SDS 4 District 2 TOTAL District 4 SDS 1 SDP 5 SDS 2 District 1 TOTAL TOTAL SDP 6 District 3 50 75 45 45 20 200 45 65 45 250 250 75 75 ILLUSTRATION TOTAL 65 Service Delivery Site 1 Service Delivery Site 4 Service Delivery Site 6 Monthly Report Service Delivery Site 2 Service Delivery Site 5 Service Delivery Site 3 Monthly Report Monthly Report ARV Nb. 45 Monthly Report Monthly Report Monthly Report ARV Nb. 75 ARV Nb. 200 ARV Nb. ARV Nb. ARV Nb. 45 20 50 Source Document 1 Source Document 1 Source Document 1 Source Document 1 Source Document 1 Source Document 1 RDQA Methodology: Data Verification
RDQA Methodology: Systems Assessment Component M&E Management Unit Service Delivery Sites / Organizations Intermediate Aggregation levels (eg. District, Region) Assessment of Data Management and Reporting Systems Assess Data Management and Reporting Systems • PURPOSE: Identify potential risks to data quality created by the data- management and reporting systems at: • the M&E Management Unit; • the Service Delivery Points; • any Intermediary Aggregation Level (District or Region). • The RDQA assesses both (1) the design; and (2) the implementation of the data-management and reporting systems. • The assessment covers 8 functional areas (HR, Training, Data Management Processes , etc.)
RDQA Outputs 1- Strength of the M&E System,evaluationbased on a review of the Program/project’s data management and reporting system, including responses to overall summary questions on how well the system is designed and implemented; 2-Verification Factorsgenerated from the trace and verify recounting exercise performed on primary records and/or aggregated reports (i.e. the ratio of the recounted value of the indicator to the reported value); 3- Available, On time and Complete Reports percentages calculated at the Intermediate Aggregation Level and the M&E Unit). 4-Action Plan for System Strengthening for each level assessed.
ILLUSTRATION Example of Systems’ Finding at the M&E Unit (HIV/AIDS)
MEASURE Evaluation is a MEASURE project funded by the U.S. Agency for International Development and implemented by the Carolina Population Center at the University of North Carolina at Chapel Hill in partnership with Futures Group International, ICF Macro, John Snow, Inc., Management Sciences for Health, and Tulane University. Views expressed in this presentation do not necessarily reflect the views of USAID or the U.S. Government. MEASURE Evaluation is the USAID Global Health Bureau's primary vehicle for supporting improvements in monitoring and evaluation in population, health and nutrition worldwide. Visit us online at http://www.cpc.unc.edu/measure