Analyzing Housing Price Trends Using Linear Models
This document explores the increase in housing prices in a neighborhood from 1990 to 1997. By plotting historical sales data, we derive a linear equation that models this trend. The slope indicates an annual price increase of $6,250, while the vertical intercept represents the estimated price in 1990. We also apply this model to predict house prices for the year 2005 and determine historical prices for specific amounts in prior years. Additionally, we examine inequalities and their graphical solutions related to advertising constraints.

Analyzing Housing Price Trends Using Linear Models
E N D
Presentation Transcript
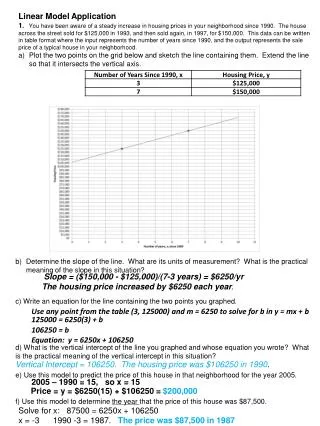
Linear Model Application 1. You have been aware of a steady increase in housing prices in your neighborhood since 1990. The house across the street sold for $125,000 in 1993, and then sold again, in 1997, for $150,000. This data can be written in table format where the input represents the number of years since 1990, and the output represents the sale price of a typical house in your neighborhood. • Plot the two points on the grid below and sketch the line containing them. Extend the line so that it intersects the vertical axis. • Determine the slope of the line. What are its units of measurement? What is the practical meaning of the slope in this situation? • c) Write an equation for the line containing the two points you graphed. • d) What is the vertical intercept of the line you graphed and whose equation you wrote? What is the practical meaning of the vertical intercept in this situation? • e) Use this model to predict the price of this house in that neighborhood for the year 2005. • f) Use this model to determine the year that the price of this house was $87,500. • Slope = ($150,000 - $125,000)/(7-3 years) = $6250/yr • The housing price increased by $6250 each year. Use any point from the table (3, 125000) and m = 6250 to solve for b in y = mx + b 125000 = 6250(3) + b 106250 = b Equation: y = 6250x + 106250 • Vertical Intercept = 106250. The housing price was $106250 in 1990. • 2005 – 1990 = 15, so x = 15 • Price = y = $6250(15) + $106250 = $200,000 • Solve for x: 87500 = 6250x + 106250 • x = -3 1990 -3 = 1987. The price was $87,500 in 1987
Put the inequality in “slope-intercept form” and graph it like a line: dashed if < or >, * solid if ≤ or ≥. Shade BELOW the line if < or ≤ Shade ABOVE the line if > or ≥
6) x > -1 8) y ≤ 3
Graph the solution to this system of inequalities: solution Shade ABOVE a DASHED line with slope 4/5 and y-intercept (0,4) Shade ABOVE a SOLID line with slope -3/2 and y-intercept (0,3)
14) y≥-x + 2 y ≤ -x +5 y ≤ 0 solution y ≤ 0 y≥-x + 2 y ≤ -x +5
What did “or” mean when working with inequalities? UNION This means you will solve both inequalities and the solution will be EVERYTHING in EACH SOLUTION 1st) Put each inequality in slope-intercept form and graph them. SOLUTION is BLUE, GREEN, and YELLOW
a) Remember absolute value inequalities? The solution of |x| ≤ k an INTERSECTION. x ≤ k AND x≥ -k |y -2x| ≤ 3 y – 2x ≤ 3 AND y – 2x ≥ -3 Put each in slope-intercept form and graph them. The solution is the INTERSECTION of the graphs (only where the shaded regions overlap). y ≤ 2x + 3 y ≥ 2x - 3 SOLUTION NOTE: If the shaded regions do not overlap in an intersection, then there is no solution. (The solution would be the empty set, )
What are we trying to find? The possible numbers of AM and FM ads that can be purchased. Let X =the number of AM ads Y = the number of FM ads Form an inequality using the given information. What does “a maximum of” mean in mathematics? “a maximum of” means less than or equal to. What are some implied restrictions? Can the number of ads be negative?