Download
1 / 36
360 likes | 504 Vues
Photonic Sensing of the Atmosphere by Absorption Spectroscopy. Xiaojuan Cui, Christophe Lengignon, Tao Wu, Weixiong Zhao, Gerard Wysocki, Eric Fertein, Cecile Coeur, Andy Cassez, Lauence Croize, Weidong Chen, Yingjian Wang, Weijun Zhang, Xiaoming, Gao, Wenqing Liu, Yujun Zhang, Fengzhong Dong.

E N D
Photonic Sensing of the Atmosphere by Absorption Spectroscopy. Xiaojuan Cui, Christophe Lengignon, Tao Wu, Weixiong Zhao, Gerard Wysocki, Eric Fertein, Cecile Coeur, Andy Cassez, Lauence Croize, Weidong Chen, Yingjian Wang, Weijun Zhang, Xiaoming, Gao, Wenqing Liu, Yujun Zhang, Fengzhong Dong. Journal of Quantitative Spectroscopy and Radiative Transfer Volume 113, Issue 11 2012 1300 - 1316 Presentation by: Ruqayyah Askar
Outline 1) Quantitative assessments of trace gas by absorption spectroscopy. * Absorption-based concentration measurements * Instrumental performance characteristics * Techniques for sensitive spectroscopic detection - Spectroscopic approaches - Digital signal processing * Photonic sensing of the atmosphere by absorption spectroscopy - Quantitative assessments of gaseous Nitrous acid (HONO) using QCLs. 2) Wavelength measurements using Michelson Interferometer as a wavemeter.
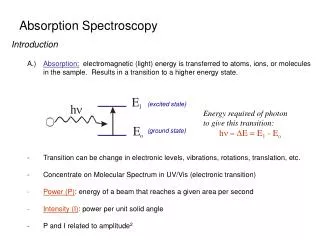
Quantitative assessments of trace gas by absorption spectroscopy Absorption-based concentration measurements Based on Beer–Lambert law, the absorbance A(ν) at frequency ν can be expressed as: A(ν)=ln( I0(ν)/I(ν)) =Nσ(ν)L I(ν) : the transmitted probing light intensity I0(ν): the incident probing light intensity N : the number of absorbing molecules in [molecules/cm3] σ(ν) : the frequency-dependent absorption cross-section in [cm2/molecule] L : the optical absorption path length in [cm]
Quantitative assessments of trace gas by absorption spectroscopy The integrated absorbance [ in cm−1 ] is AI= ∫A(ν)dν =∫ln(I0(ν)/I(ν))dν=NL∫σ(ν)dν=NLS Where S is the molecule absorption line intensity [ in cm−1/(molecule×cm−2)] S = ∫σ(ν)dν
Quantitative assessments of trace gas by absorption spectroscopy Trace concentration of absorbing molecule in the vapor or gas phase is usually expressed in terms of - ppmv (parts per million by volume, 10−6) - ppbv (parts per billion by volume, 10−9) - pptv (parts per trillion by volume, 10−12) - ppqv (parts per quadrillion by volume, 10−15) The gas species concentrationC can be retrieved from the integrated absorbance AI measured at temperature T and pressure P : C = N/NT = (AI P0T ) / (NL P T0 L S) Where the Loschmidt numberNL=2.6868×10¹⁹ molecules/cm3 at T0=273.15 K andP0=760 Torr.
Quantitative assessments of trace gas by absorption spectroscopy Instrumental performance characteristics SNR refers to signal-to-noise ratio. ( 1σ means: SNR=1 ) * Measurement sensitivity Sensitivity is usually expressed in terms of: - minimum detectable absorption coefficient (MDAC) - minimum detectable concentration (MDC) Where Cmin = C / SNR Major noise sources: • White noise Thermal noise from electronic detection systems Quantum ( shot ) noise • 1/f noise • Background fringes noise Optical interference effects Optical reflection losses
Quantitative assessments of trace gas by absorption spectroscopy Instrumental performance characteristics * Measurement selectivity High spectral resolution spectroscopic measurements is needed. Methods are: 1 Selection of spectral lines well isolated from interfering lines of other gas species. By scanning the frequency of a narrow linewidth laser across the individual absorption lines in the infrared region. • Performing spectral measurements at a reduced pressure to avoid spectral line • overlapping due to pressure-broadening. • In the UV–visible spectral region, as molecular absorption exhibits usually broad • band absorption feature, discrimination and concentration retrieval of the target • gases is achieved by the use of a multivariate analysis approach.
Quantitative assessments of trace gas by absorption spectroscopy Instrumental performance characteristics * Measurement accuracy Accuracy influenced by: Uncertainties on P and T. According to Uncertainties on absorption path length L. Uncertainties on molecular line absorption intensity S. Calibrated standard reference may be used direct calibration of concentration measurements. higher accuracy determination of the line parameters being used for concentration retrieval.
Quantitative assessments of trace gas by absorption spectroscopy Instrumental performance characteristics * Measurement precision Related to: Stability of the spectroscopic measurements, which can be characterized by Allan variance analysis. Measurement errors. SNR The most important limiting factor for achieving high precision. * Dynamic measurement range Limited by linear response of the detector. Using a single detector in spectroscopic absorption-based concentration High dynamic range detection By use of strong and weak absorption lines for low and high concentration measurements, respectively. Dynamic range approaching 6 orders of magnitude might be achieved.
Quantitative assessments of trace gas by absorption spectroscopy Techniques for sensitive spectroscopic detection * Spectral region selection to address strong absorption intensity In the UV-visible region (250–700 nm), the absorption is due to fundamental electronic transition associated with vibration-rotation structure. In the mid-infrared region (2.5–25 μm), almost all molecules exhibit strong absorption intensities arising from fundamental vibrational–rotational transitions with specific molecular signature (this region is also called infrared fingerprint region). Stronger fundamental absorption intensities sensitive detection of trace gases
Fig. 1. CH4 absorption intensities in the different infrared spectral regions.
Quantitative assessments of trace gas by absorption spectroscopy Techniques for sensitive spectroscopic detection ** Spectroscopic approaches In direct measurement of absorption by target gases, a small change ΔI in a large transmitted probe light intensity (background) I0(ν) is to be measured. ΔI = I0(ν)–I(ν) • As a result, detection sensitivity is mainly limited by the fluctuations in the detected background intensity. • Fluctuations in the detected background intensity may be resulted from: • Probe light excess noise • System thermal drift • Optical feedback and interference fringes due to etalon effects.
The background noise limited detectivity is in the range of ΔI/I0(ν)≈10−3, which is very far away from the requirement of 10−7–10−8 for sensing the environment around us. Various highly sensitive spectroscopic techniques have been developed and extensively reviewed. Techniques currently used for absorption spectroscopy detection: • Long path length absorption. • Light modulation-phase sensitive detection. • Sweep integration approach. • Dual-beam balanced detection. • Indirect measurements of gas absorption.
Long path length absorption Lowering the detection limits can also be achieved by enhancing the light-molecule interaction time. Long path length absorption by multiple reflections of probing light in a multipass optical cell providing effective optical path length 18-200 m. or in high fineness optical cavity where light bounces back and forth thousand times leading to 1- 10 km long optical absorptions. Cavity Enhanced Absorption Spectroscopy (CEAS)
Example of a multipass optical cell [2] • Characteristics: • The structure is a combination of White • cell and Herriott cell. • It’s configurations require only standard mirrors. • Allows a very great number of reflections. • Only limited by the coefficient of reflections of the mirrors. • The configuration is simple, compact, stable and cheap. • Injection and recovery of the beams can be on the side of the two mirrors (configuration I2M) or on the side of the single mirror (I1M). • - Path lengths are controlled by a single • adjustment. • Gives a total path length = 2N(M+1)D • N: number of reflections of each mirror • in Herriott configuration. • M: the number of focused reflection • points between the input and output • points. • D: Distance between mirrors.
Light modulation-phase sensitive detection ( Lock-in technique ) Low frequency fluctuation in probe light intensity can significantly degrade the measurement sensitivity and precision This technical noise is characterized by a power spectral density proportional inversely to frequency. It is denoted as 1/f noise ( pink noise or flicker noise). Reduction of 1/f noise by using modulation techniques to shift the absorption signal away from the base band and perform the detection at a relatively high frequency domain for eliminating the 1/f noise. By wavelength modulation spectroscopy (WMS) with modulation frequencies 10–100 kHz. By frequency modulation spectroscopy (FMS) employing modulation frequencies ranging between several MHz up to GHz. 1) Modulation
Light modulation-phase sensitive detection ( Lock-in technique ) 2) Phase-sensitive detection at harmonics of the modulation frequency for demodulation of the modulated signal within a narrow lock-in pass band to remove 1/f-noise. Beyond 100 MHz 1/f-noise contribution can be ignored
Sweep integration approach Definition: It’s a signal averaging approach in combination with fast sweeping laser wavelength across the absorption line(s). Characteristics: - A simple but efficient way to remove white noise. - By averaging N spectra, the noise may be reduced by a factor of N1/2. - After an optimum value is reached, the instabilities of the instrumental system may nevertheless counterbalance the noise reduction given by average. - The optimum averaging time can be determined by an Allan variance analysis.
Fig. 2. (left):Effects of averaging spectra on improvement in SNR: from averaging number of N=10 to N=600,000 [31]. As can be seen, the optimum N is about 5000.When N>5000, fluctuation in spectral baseline appears, resulting from the system instability; (right): Allan variance plot (black) as a function of averaging time, associated with a 1/t slope (redline), which shows an optimum averaging time of about 90 s [32].
Dual-beam balanced detection Description: Two detectors are basically used to reduce light excess noise through photocurrents cancellation. Advantages: - A useful technique for removing excess noise in probe light. - This technique is capable of reducing common-mode excess light intensity noise by more than 50 dB and yielding a near-shot-noise limited measurement sensitivity. Disadvantages: - In practice, inherent difference between two used detectors may dramatically reduce the improvement in sensitivity. - Its utilization in multiple-reflection-based long path length absorption spectroscopy is not efficient. As the reference beam could not experience the same multiple reflections Optical noise resulting from the etalon effects would not be fairly canceled by dual-beam balanced detection.
Indirect measurements of gas absorption Indirect measurements methods rely on the measurement of absorption induced physical parameter from which the absorber concentration can be inferred the effects of fluctuation in probe light intensity on the system detectivity can be minimized.
Quantitative assessments of trace gas by absorption spectroscopy Techniques for sensitive spectroscopic detection ** Digital signal processing Digital data processing after data acquisition can be performed to further improve the analytical SNR. Examples of applied computer algorithms: - Averaging and Smoothing - Passive and Adaptive Filtering - Fourier transform and correlation analysis - Digital Lock-in detection Examples of data processing to be discussed: - Fringe noise removal. - Adaptive filtering technique.
Fringe noise removal Periodic oscillatory structure superimposed on the baseline or absorption feature is a serious issue to be addressed for sensitive spectroscopic measurements. Optical fringes: - Source : Arising from the Fabry-Perot etalon effects among optical components, in particular when implementing multipass cell or optical cavity approach. - Solution1: Can be first reduced by careful optical design and alignment to avoid optical feedback by dithering optical elements. (The best design practice for multipass cells is to avoid overlap of neighboring spots on the mirror) - Solution2: Could be normalized out by a synthetic baseline. Fig. 3 shows a result reported by Weidong Chen and co-worker.
Fig. 3. Removal of fringe noise from spectral background using synthetic baseline [62]. Left: Experimental spectrum (upper curve). The lower line is a synthetic baseline. Right: water vapor absorption spectra near 1844/cm after baseline correction (lower curve) by normalizing the experimental spectrum to the synthetic baseline. The upper line is a theoretical simulation assigned by using the HITRAN database [5].
Adaptive filtering technique Further improvements in sensitivity can be obtained by using adaptive digital filter that is capable of adapting to real measurement environment via self-adjustment of its transfer function. Examples of using Kalman filter will be discussed. As Kalman filter uses a recursive procedure for “true value” prediction based on the previously determined value, it can be adaptive to real-time noise and data statistics. Kalman adaptive filter can thus efficiently remove the shot-to-shot fluctuation in the real time measured data while without affecting the measurements of time evolution of trace gas concentration (non-stationary).
Example 1: Leleux and co-worker successfully applied Kalman filtering technique to simultaneous detection of NH3 and CO2 with a diode-laser-based sensor operating at 1.53 μm. A sensitivity enhancement of 6times was achieved.
Example 2: Recently, Tao Wu and co-worker applied Kalman filtering to real-time water isotopic ratios measurements using laser absorption spectroscopy at 2.73 μm. They applied discrete Fourier transform to fit a residual spectrum exhibiting sinewave-like undulation to determine the oscillation frequencies, and then removed the fringes noise from the baseline with an adapted Fourier filtering. High measurement precisions (<1‰) have been realized for the oxygen and hydrogen isotopologue ratios δ18O, δ17O and δ2H in water by sampling the output of a Kalman filter at 1-s time intervals, while 30-s is needed for the same precision level when using a standard running average technique.
Photonic sensing of the atmosphere by absorption Spectroscopy Particular interest is in spectral range of 3–5 μm and 8–12 μm in the mid-infrared (mid-IR). Reason: Several types of continuous-wave lasers are available as photonic probing sources for this mid-IR region: - lead-salt diodes - color-center lasers - optical parametric oscillators - difference frequency generation - quantum cascade lasers ( recently available ) - fiber lasers QCLs the most useful laser source for mid-IR gas sensor application nowadays. - high single-mode output power - single-frequency tunability - narrow emission linewidth - wide spectral coverage - room temperature operation and commercial availability
Photonic sensing of the atmosphere by absorption Spectroscopy Absolute quantitative assessments of gaseous Nitrous acid (HONO) Technique: Quantum cascade lasers-based long path length absorption spectroscopy at 8 μm. A thermoelectric cooled (TEC) VIGO detector (PVMI-4TE-10.6) Optical length up to ∼100 m. Probe light operating at 1254.6 cm−1 (∼8 μm). Free spectral range of ∼0.03 cm−1 for relative wavelength calibration A single-mode output power of up to 35 mW. Fig. 4. (a): QCL-based laser instrument set-up.
Fig. 4. (b) Absorption spectrum of 95 ppm HONO at a pressure of 44 mbar in a 26.3 m long multipass cell. The laser wavelength was scanned at a rate of 2.5 kHz. Results: - Experimentally recorded absorption spectrum of HONO near 8 μm is shown inFig. 4(b). • A 1σ MDC of 396 pptv was achieved for 1-s integration time by 125 m long path absorption in a multipass cell. • The accuracy was estimated to be 10%, mainly limited by accuracy of line intensity of HONO used for concentration retrieval.
Michelson Interferometer Basic principle Incident plane wave: split into two waves: Fig. 5. Two beam interference in a Michelson interferometer. by a beam splitter of negligible absorption ( R+T=1)
Michelson Interferometer Amplitudes are determined by: where Total Field amplitude coming out is The detector measures the time-averaged intensity:
Michelson Interferometer as a Wavemeter Michelson interferometer can be used for absolute wavelength measurements. From the ratio of both counting rates, we can find the unknown wavelength:
Michelson Interferometer as a Wavemeter Fig. 6. Traveling Michelson interferometer for accurate measurements of wavelengths of single mode cw lasers.
Sources: Thank you