Download
1 / 42
420 likes | 534 Vues
The Australian National Plasma Fusion Research Facility: Results and Upgrade Plans.

E N D
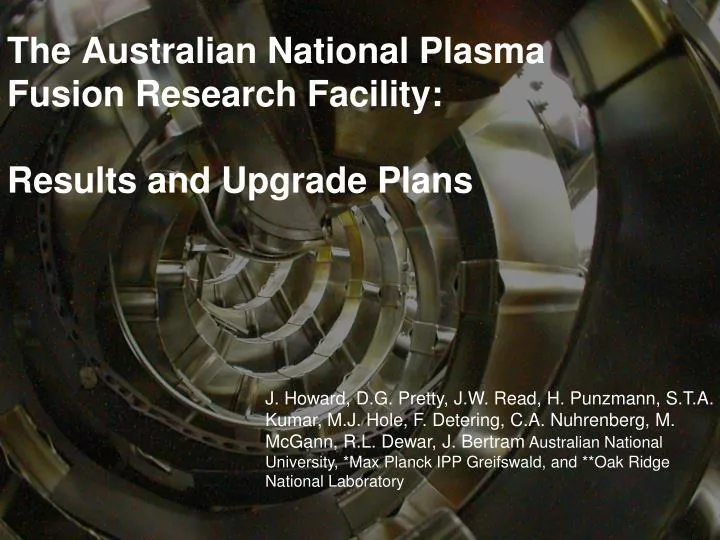
The Australian National Plasma Fusion Research Facility: Results and Upgrade Plans J. Howard, D.G. Pretty, J.W. Read, H. Punzmann, S.T.A. Kumar, M.J. Hole, F. Detering, C.A. Nuhrenberg, M. McGann, R.L. Dewar, J. BertramAustralian National University, *Max Planck IPP Greifswald, and **Oak Ridge National Laboratory
The Australian National Plasma Fusion Facility: Results and Upgrade Plans H-1 Plasma and Facility Plasma configurations, parameters MHD Modes Data mining Alfvénic Scaling Scaling discrepancies Optical Measurements Radial Structure Confinement Effects Effect of Magnetic Islands Facility Upgrade Aims Key areas New diagnostics for Upgrade Conclusions/Future
H-1NF: National Plasma Fusion Research Facility A Major National Research Facility established in 1997 by the Commonwealth of Australia and the Australian National University Mission: • Detailed understanding of the basic physics of magnetically confined hot plasma in the HELIAC configuration • Development of advanced plasma measurement systems • Fundamental studies including turbulence and transport in plasma • Contribute to global research effort, maintain Australian presence in the field of plasma fusion power The facility is available to Australian researchers through the AINSE1 and internationally through collaboration with Plasma Research Laboratory, ANU. 1) Australian Institute of Nuclear Science and Engineering limited collaborative funding expires June 2010 – please come! International collaboration played an important role in the success of H-1 in obtaining facility funding
H-1 Heliac: Parameters 3 period heliac: 1992 Major radius 1m Minor radius 0.1-0.2m Vacuum chamber 33m2 excellent access Aspect ratio 5+ toroidal Magnetic Field 1 Tesla (0.2 DC) Heating Power 0.2MW 28 GHz ECH 0.3MW 6-25MHz ICH Parameters: achieved to date::expected n3e18 :: 1e19 T<200eV(Te)::500eV(Te) 0.1 :: 0.5%
H-1 configuration (shape) is very flexible • “flexible heliac” : helical winding, with helicity matching the plasma, 2:1 range of twist/turn • H-1NF can control 2 out of 3 oftransform () magnetic well and shear (spatial rate of change) • Reversed Shear Advanced Tokamak mode of operation low shear = 4/3 = 5/4 medium shear Edge Centre
Experimental confirmation of configurations Santhosh Kumar Rotating wire array • 64 Mo wires (200um) • 90 - 1440 angles High accuracy (0.5mm) Moderate image quality Always available Excellent agreement with computation T.A. Santhosh Kumar B.D.Blackwell, J.Howard Iota ~ 1.4 (7/5)
Mode Decomposition by SVD and Clustering D. Pretty, Tues am Data mining • 4 Gigasamples of data • 128 times • 128 frequencies • 2C20 coil combinations • 100 shots • Initial decomposition by SVD ~10-20 eigenvalues • Remove low coherence and low amplitude • Then group eigenvalues by spectral similarity into fluctuation structures • Reconstruct structuresto obtain phase difference at spectral maximum • Cluster structures according to phase differences (m numbers) reduces to 7-9 clusters for an iota scan Grouping by SVD+clustering potentially more powerfulthan by mode number • Recognises mixturesof mode numbers caused by toroidal effects etc • Does not depend critically on knowledge of thecorrect magnetic theta coordinate increasing twist Blackwell, International Meeting on the Frontiers of Physics, Malaysia 2009
Data Mining Classification by Clustering D. Pretty, Tues am Full dataset
Identification with Alfvén eigenmodes: k||, twist Small near resonance Why is f so low? VAlfven~ 5x10⁶ m/s • res = k||VAlfvén = k||B/(o) • k|| varies as the angle between magnetic field lines and the wave vector • for a periodic geometry the wave vector is determined by mode numbers n,m • Component of k parallel to B is - n/m k|| = (m/R0)( - n/m) res = (m/R0)( - n/m)B/(o) • Low shear means relatively simple dispersion relations – advantage of H-1 Alfvén dispersion (0-5MHz) Alfvén dispersion (0-50kHz) Near rationals, resonant freq. is low }
Two modes coexisting at different radii Cross-power between ne and Mirnov coils shows two modes coexisting (0,180o) Probably at different radii as frequency is different, mode numbers the same
Phase flips, character changes near rational • The sense of the phase between the magnetic and light fluctuations changes about the resonance • More “sound-mode” like. (red is optical emission ne). Iota scanning in time
CAS3D: 3D and finite beta effects Carolin Nuhrenberg Gap forms to allow helical Alfven eigenmode, and beta induced gap appears at low f Beta induced gap ~5-10kHz Coupling to “sound mode”
Beta-induced Alfvén eigenmodes? • At low beta in H-1 (10-4), the beta-induced gap is in the range 5-10kHz. • This is within the range of the modes near resonance, when iota-n/m is small • Beta induced gap scales with temperature rather than magnetic field • interactions between the beta induced gap and Alfvén continuum could help explain the ambiguous B dependence. • Scaling of f ~n/m (not - n/m) does not explain observed dependence of frequency on . 10kHz
New PMT array mode rotation information 16 channel PMT for broadband light emission measurements. • Views plasma at an angle breaks the symmetry • Forward modelling shows shear in the projections (which depends on poloidal rotation direction) • Data shows this effect ion diamag rotation direction radius Intensity (arbitrary units) radius
Radial Mode Structure Jesse Read Cross-power between light emissionand Mirnov coils shows phase flips in radius and on either side of “V” resonance Configuration (increasing twist ) phase Radius number of radial nodes increases with the poloidal wavenumber. Blackwell, Tohoku, Sendai 2009
Mode structure via synchronous 2D imaging • Intensified Princeton Instruments camera synchronised with mode using the intensifier pulse as a high speed gate. (256x256) • Total light or Carbon ion line imaged for delays of 0....1 cycle • Averaging is performed in the camera image plane, background removed by subtracting an unsynchronised shot. Intensity (arbitrary units)
MHD: synchronous 2D imaging • Mirnov coil used as a reference signal. • PLL then matches the phase of its clock to the reference. • PLL output pulses drive the ICCD camera. • Delay output to explore MHD phase Performance Amplitude Time (s)
Modelling the Mode • For comparison the camera view was modelled. Allowing us to calculate expected line-integrated profiles. • Asymmetric views cause tilt in profiles which indicate the poloidal rotation direction of the mode.
Comparison with Model Intensity Profile Amplitude (arbitrary units) • Images clearly show the mode’s helical structure. • Even parity, four zero crossings m ≥ 4. • Images at different time delays (between PLL pulse and camera gate) shows mode rotation. • Mode structure and rotation direction determined by comparing to model. Vertical Position Profile segment line
Comparison with Model (ii) Mode Model • Comparing with model of m=4 mode revealed an edge-localised mode. • Asymmetry rotation direction. Pixel Position Pixel Position Time Time Result of asymmetry (plasma not central in camera view) Image (DC removed) Model (poloidal cross-section)
Mode Tomography Mode Model • arbitrary radial profile, m=4, n=5 • Match sightline integrals with data • Use data from 18 different phases • Mode appears narrow in radius Data and reconstruction Result of asymmetry (plasma not central in camera view) Peaked at r/a ~0.7 Sin/coscpts Image (DC removed) Model (poloidal cross-section) 0.4 0.6 (r/a) 0.8 1.0
Scaling discrepancies res = k||VAlfvén = k||B/(o) • Numerical factor of ~ 1/3 required for quantitative agreement near resonance • Impurities (increased effective mass) may account for 15-20% • 3D MHD effects ~ 10-30% (CAS3D), still a factor of 1/1.5-2x required • Magnetic field scaling is unclear • Unknown drive physics • VAlvfen ~5e6 m/s – in principle, H+ ions are accelerated by ICRH, but poor confinement of H+ at VA (~40keV) makes this unlikely. • More complete analysis of orbits with H-1 paramaters (NazikianPoP 2008) reduces required ion energy considerably • H+ bounce frequency of mirror trapped H+ is correct order? • Electron energies are a better match, but the coupling is weaker. (mechanism?)
Island Effects Blackwell, International Meeting on the Frontiers of Physics, Malaysia 2009
Good match confirms island size, location computed + e-beam mapping (blue/white) Good match between computed and measured surfaces • Accurate model developed to account for all iota (NF 2008) • Minimal plasma current in H-1 ensures islands are near vacuum position Sensitive to shear identify sequence number high shear surfaces “smear” Iota ~ 3/2 Iota ~ 1.4 (7/5)
Effect of Islandson Plasma Santhosh Kumar • LHD, JT60U results show • Te profile flattened – radial transport high (inside side to outsideside) • But this doesn’t mean that internal transport is high (from the inside to the outside of the island.) • Internal rotational transform is quite low and can complicate experiments • 10 to 100 toroidal transits to circumnavigate island? Conditions: Argon plasma ~10eV Te~ 10 eV, Ti~ 10 eV ∼30-80 eV electron density ∼ 1 × 10¹⁸/m3 nn < neutral fill density ∼ 0.81 × 10¹⁸/m3 ρe ∼ 0.075 mm, ρi ∼35-55 mm νei ∼ 9×10⁵/sec νen ∼ 1.6×10⁵/sec Collision mean free path λei ∼2.5 m, λen ∼8 m
Effect of Magnetic Islands Santhosh Kumar Giant island “flattish” density profile Possibly connected to core electron root enhanced confinement Central island – tends to peak
Spontaneous Appearance of Islands Santhosh Kumar Iota just below 3/2 – sudden transition to bifurcated state Plasma is more symmetric than in quiescent case. Uncertainty as to current distribution (and therefore iota), but plausible that islands are generated at the axis. If we assume nested magnetic surfaces, then we have a clear positive Er at the core – similar to core electron root configuration? Many unanswered questions……Symmetry?How to define Er with two axes?
Unanswered Questions Issues Remaining: What is the correct analysis for Er? When does the plasma “see/not see” islands” collisionality, i, einternal transform are important What is the most robust indicator of surface number? (p? – varies with ne by a fraction of Te (Boltzmann relation)) Alternatives for “Correct” analysis for Er? If we take the axis at the core core electron root If we assume two axes, then ion root, but field is still large (characteristic of e-root) [Conditions for usual e-root picture (1/, trapped e) not met]
Facility Upgrade (New) Rudd Government “Super Science Package” boosted National Collaborative Infrastructure Program using the “Educational Infrastructure Fund” Restrictions on this fund limit use to infrastructure ~US$5M over 4 years for infrastructure upgrades 2009Australian Budget Papers Funding agreement to be signed this year Quarterly Milestones
Aims of Facility Upgrade Consolidate the facility infrastructure required to implement the ITER forum strategy plan Try to involve the full spectrum of the ITER forum activities More specifically: • Improve plasma production/reliability/cleanliness • RF production/heating, ECH heating, baking, gettering, discharge cleaning • Improve diagnostics • Dedicated density interferometers and selected spectral monitors permanently in operation • Increasing opportunities for collaboration • Ideas? • Increasing suitability as a testbed for ITER diagnostics • Access to Divertor – like geometry, island divertor geometry
RF Upgrade • RF (7MHz) will be the “workhorse” • Low temperature, density limited by power • Required to initiate electron cyclotron plasma New system doubles power: 2x100kW systems. New movable shielded antenna to complement “bare” antenna (water and gas cooled). Advantages: • Very wide range of magnetic fields in Argon • New system allows magnetic field scan while keeping the resonant layer position constant.e.g. to test Alfven scaling MHD • Additional ECH source (10/30kW14/28GHz) for higher Te
Improved Impurity Control Impurities limit plasma temperature (C, O, Fe, Cu) High temperature (>~100eV) desirable to excite spectral lines relevant to edge plasma and divertors in larger devices. Strategy - Combine: • Glow discharge cleaning for bulk of tank • Pulsed RF discharge cleaning for plasma facing components. • antenna (cooled) and source (2.4GHz) • Low temperature (90C) baking • Gettering
Small Linear Satellite Device – PWI Diagnostics Purpose: Testing various plasma wall interaction diagnostic concepts spectroscopy, laser interferometry, coherence imaging Features: Much higher power density than H-1 Clean conditions of H-1 not compromised by material erosion diagnostic tests Simple geometry, good for shorter-term students, simpler projects Shares heating and magnet supplies from H-1 Circular coils ex Univ Syd. machines Magnetic Mirror/Helicon chamber?
New Toroidal Mirnov Array View of plasma region through port opening Mounted next to Helical • Coils inside a SS thin-wall bellows (LP, E-static shield) • Access to otherwise inaccessible region with • largest signals and • with significant variation in toroidal curvature.
Quadrature Doppler imaging on H-1(Angular multiplex) Angle multiplexing through a polarization interferometer produces quadrature images of the interferogram at the 4 corners of a CCD camera CAD view of coil set and view port View of plasma region through port opening CAD view of coil set and view port, including plasma Brightness Ion temperature Flow profile 2-D, quadrature Doppler imaging
Hybrid Spatial-temporal multiplex Raw image time 1 Raw image time 2 MSE polarization Fringe visibility Normalized interferogram 1 Normalized interferogram 2 Produced first full image of magnetic field in TEXTOR! (using MSE)
Conclusions • We show strong evidence for Alfvénic scaling of magnetic fluctuations in H-1, in ne, iota and . • Scaling in B is unclear however, and an unexplained factor of ~3 in the frequency of near-resonant modes. • The driving mechanism is not understood • Interferometer CCD camera and PMT array valuablemode structure Information • First indication is that mode is quite narrow radially • Island experiments well suited to H-1 (Argon is not so good!) • Is plasma potential is the best (“most constant”) surface label in this case? • Spontaneous bifurcation is similar to core electron root improved phenomenon, but how to interpret this if the flux surfaces are bifurcated?
Future • New Toroidal Mirnov Array • Bayesian MHD Mode Analysis • Toroidal visible light imaging (CII 525nm) • Correlation of multiple visible light, Mirnov and n~ e data • Spatial and Hybrid Spatial/Temporal Coherence Imaging • Facility upgrade! • Develop divertor and edge diagnostics • Develop PWI diagnostics (materials connection) • Study stellarator divertors, baffles e.g. 6/5 island divertor
Advanced imaging systems International Science Linkages funding $700K (US, Korea, Europe, 2004-) Systems developed under external research contracts for Japan, Korea, Germany, Italy ($480K) John Howard View of plasma region through port opening • World’s first 2D image of internal plasma magnetic field on TEXTOR • (Howard 2008) • Signal processing, probabilistic data analysis, inverse methods (ANU) • International Science Linkages funding $430K (UKAEA 2008- ) • Laser-based probing (USyd, ANU) • Atomic and molecular physics modeling (Curtin, ANU, Flinders) • Complex and dusty plasmas (USyd)
Identification with Alfvén eigenmodes: k|| 0 as twist n/m = 4/3 ota David Pretty res = k||VA = (m/R0)( - n/m)B/(o) • k|| varies as the angle between magnetic field lines and the wave vector k|| - n/m • iota resonant means k||, 0 Expect Fresto scale with iota Resonant Twist