Download
1 / 27
270 likes | 291 Vues
Explore the differences between (T)AMDAR aircraft observations and RUC model forecasts through statistical analysis for data quality assessment at NOAA's ESRL using extensive data sources and plan views.

E N D
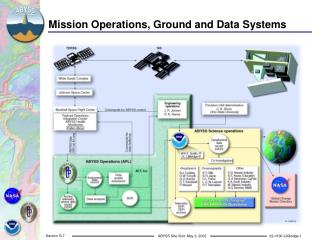
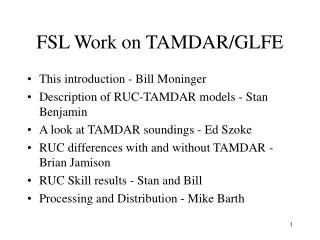
TAMDAR/AMDAR Data Assessments using the RUC at NOAA’s Global Systems Division Part of NOAA’s Earth System Research Laboratory (ESRL) Bill Moninger, Stan Benjamin, Randy Collander, Brian Jamison, Tom Schlatter, Tracy Smith, Ed Szoke
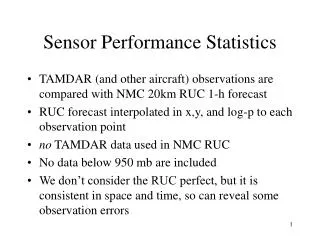
(T)AMDAR QC at GSD • AMDAR data are automated met. reports from aircraft – primarily jets • TAMDAR data are taken by a special TAMDAR sensor mounted on turboprop aircraft • In this study, we look at differences between • (T)AMDAR observations, and • 1h forecasts from the RUC model
The Rapid Update Cycle (RUC) • An hourly cycle • Ingests all available data each hour • AMDAR, TAMDAR, RAOBS (0 & 12 Z), Satellite, Surface, etc., etc. • Covers the CONUS • We run many RUC cycles at GSD • For this study, we use a 20 km cycle called “dev2” • (Stan will say more in the next talk)
(T)AMDAR - RUC Comparisons • Statistical results are available at http://amdar.noaa.gov/ruc_acars/ • Time series for individual aircraft • 3 and 7 day interactive statistics • plan view of data and corresponding RUC values • (summary statistics are open; real-time data are restricted)
http://amdar.noaa.gov/ruc_acars/ Plan view showing W-rejects for TAMDAR. Reject reason indicated. Overall statistics shown
Current (T)AMDAR Data Quality • To assess this we look at long-term statistics of observations with respect to the RUC dev2. • RUC, when a long time period is aggregated, can serve as a common denominator that does not favor any particular observation system • Results to follow are from • 1-31 Dec. 2006 • (T)AMDAR data from 0 UTC +/- 30 minutes • 200 - 800 observations per pressure level • Canadian jets and all turboprops excluded • All observations included, even those that fail RUC QC (excluding them makes little difference here) • In the Great Lakes Region • 13 RAOBs at 0 UTC
Temperature “bias” (wrt RUC dev2) for data taken near 0 UTC AMDAR - dev2 1h fcst Temperature RMS difference for obs taken near 0 UTC Red shows aircraft ascents and en-route Blue shows aircraft descents
Temperature “bias” (wrt RUC dev2) for data taken near 0 UTC AMDAR jets TAMDAR (open circles) Red shows aircraft ascents and en-route Blue shows aircraft descents
Temperature “bias” (wrt RUC dev2) for data taken near 0 UTC AMDAR jets TAMDAR (open circles) RAOB (green) All data sources show generally good agreement with the RUC. |bias T| < 0.5 °C except very near surface Red shows aircraft ascents and en-route Blue shows aircraft descents
Temperature RMS (wrt RUC dev2) for data taken near 0 UTC AMDAR - dev2 1h fcst Temperature RMS difference for obs taken near 0 UTC Red shows aircraft ascents and en-route Blue shows aircraft descents
Temperature RMS (wrt RUC dev2) for data taken near 0 UTC AMDAR jets TAMDAR (open circles) Red shows aircraft ascents and en-route Blue shows aircraft descents
Temperature RMS (wrt RUC dev2) for data taken near 0 UTC AMDAR jets TAMDAR (open circles) RAOBs (green) All data sources show good temperature agreement with the RUC Red shows aircraft ascents and en-route Blue shows aircraft descents
RMS of vector wind difference (wrt RUC dev2) for data taken near 0 UTC For RMS of the vector wind difference with the RUC… Red shows aircraft ascents and en-route Blue shows aircraft descents
RMS of vector wind difference (wrt RUC dev2) for data taken near 0 UTC AMDAR jets TAMDAR (open circles) TAMDAR wind errors are higher because of poor heading information from the Mesaba turboprops. Worse on descents due to maneuvers. Red shows aircraft ascents and en-route Blue shows aircraft descents
RMS of vector wind difference (wrt RUC dev2) for data taken near 0 UTC AMDAR jets TAMDAR (open circles) RAOBs (green) AMDAR jets and RAOBs show similar wind error characteristics. Red shows aircraft ascents and en-route Blue shows aircraft descents
Relative Humidity “bias” (wrt RUC dev2) for data taken near 0 UTC TAMDAR (open circles) Red shows aircraft ascents and en-route Blue shows aircraft descents
Relative Humidity “bias” (wrt RUC dev2) for data taken near 0 UTC TAMDAR (open circles) RAOBs (green) TAMDAR descent “bias” is similar to RAOBs Ascent bias is a little wetter Generally, RH bias < 5% Red shows aircraft ascents and en-route Blue shows aircraft descents
Relative Humidity RMS (wrt RUC dev2) for data taken near 0 UTC TAMDAR (open circles) Red shows aircraft ascents and en-route Blue shows aircraft descents
Relative Humidity RMS (wrt RUC dev2) for data taken near 0 UTC TAMDAR (open circles) RAOBs (green) Red shows aircraft ascents and en-route Blue shows aircraft descents
Relative Humidity RMS (wrt RUC dev2) for data taken near 0 UTC TAMDAR (open circles) RAOBs (green) • TAMDAR RH differences with RUC are generally smaller than RAOB RH differences. • However, RAOBs are at an unfair disadvantage because: • 1h earlier TAMDAR affected the analysis • We assume RAOBs ascend vertically for this plot (the RUC uses the true location of each RAOB ob) Red shows aircraft ascents and en-route Blue shows aircraft descents
Summary • For temperature: TAMDAR does as well as AMDAR jets in the altitude range it covers • For winds: TAMDAR measurements are substantially worse, particularly on descent, due to poor heading info provided by Mesaba turboprops. (Nonetheless, they make a positive impact on RUC wind forecasts, as shown in the next talk) • For relative humidity: TAMDAR does approximately as well as RAOBs
Relative Humidity RMS (wrt RUC dev2) for data taken near 0 UTC TAMDAR (open circles) RAOBs (green) NAM assumed RAOB RH errors (black) Red shows aircraft ascents and en-route Blue shows aircraft descents
Relative Humidity RMS (wrt RUC dev2) for data taken near 0 UTC TAMDAR (open circles) RAOBs (green) NAM assumed RAOB RH errors (black) RMS is slightly larger than assumed RAOB absolute error, as is to be expected for a forecast rather than an analysis. Red shows aircraft ascents and en-route Blue shows aircraft descents
Right column shows the RUC reject code for any rejected variable(s) This information is downloaded automatically by some users.
7-day summary statistics (sortable). New columns show the fraction of obs rejected by the RUC, for each variable. We reject many TAMDAR winds because we don’t accept descent winds currently