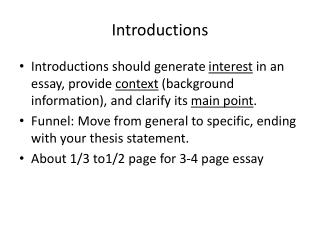
Introductions
Introductions. Paul Rains – IPP HR SYSTEMS PROJECT MANAGER. RAC People P&L - A Human Measurement Case Study. A roadmap to effective Human Capital Management (HCM). RAC People P&L – Topics. Background Key Drivers Solutions considered Positive Outcomes Lessons Learnt . RAC Company History.

Introductions
E N D
Presentation Transcript
Introductions Paul Rains – IPP HR SYSTEMS PROJECT MANAGER
RAC People P&L - A Human Measurement Case Study A roadmap to effective Human Capital Management (HCM)
RAC People P&L – Topics • Background • Key Drivers • Solutions considered • Positive Outcomes • Lessons Learnt
RAC Company History • Leading Motoring Services company in the UK, established in 1897 • Services more than 7 million motorists, attending 2.76 million breakdowns last year • Headcount 11,646, FTE 11,182.03 • Profit before tax* • 2004 - £88.6m – Up 24.39% since 2002 • Profit per FTE • 2004 - £8,051.42 – Up 43.93% since 2002
Key Influencing Factors • Archie Norman of Asda fame joins plc board as an advisor after sale to Wallmart. Plc Board aspire to Asda’s achievement of the top UK company to work for. • C.E.O. 3 balls concept – People focused • Happy people = happy customers = happy shareholders • HR Director invited to join ‘accounting for people’ taskforce set up by the government • Employee satisfaction survey introduced • Plc Board ask for monthly report on People data as well as the usual financial information. • RAC Key People values introduced and linked to colleagues appraisals, PDP’s and Recruitment criteria.
A Significant Culture Change • HR elevated to highest profile in group • HR Director appointed to the Plc Board • Group HR System seen as strategic system as opposed to a business support system • HR given more responsibility to support the businesses at operational level • Additional HR resources recruited – Headcount trebled! • New HR structure to reflect new responsibilities
HR Structure Plc Board HR Board PLC Strategic HR LVL Local HR RAC Local HR BSM Local HR Lex Multipart Local HR
The Very First People P&L • Conceived in 2001 • First Group-wide HR “Balanced Scorecard” • HR measures package supporting • Turnover • Stability • Absence • Retention • Colleague Satisfaction • Strategic High Level KPI monitoring • Delivered using a series of Cognos Impromptu Reports
Initial Operational Issues • Manual Process • 300+ org units * 10 reports = potential 3000+ reports every month • Huge workload • Slow to collate • Labour intensive • Lacked flexibility • Lacked credibility, distrust of data • Affected HR System performance • Lack of consistency in the data
Potential Solutions • Automate existing processes • Evaluate B.I. alternatives • Report directly from HR system • Data warehouse approach • Benchmark using other external company
Positives Cheap option Negatives Still meant a large volume of reports to produced and printed / distributed No-online access for managers Still impact on HR system performance Automate Existing Process
Negatives Lacks depth and flexibility Resource hungry Personnel, IT & HR System No single version of the truth Single source data Limited form of analysis Scorecarding Trending Predictive analysis Reporting from HR System Positives • Cheap option • Produces high level reports • A limited form of analysis
Negatives Lacks Depth Doesn't identify where issues exist at the coalface External Benchmarking Positives • Provides Peer comparison • Can assist company's identify broad issues
Negatives Cost Complex Structure Additional hardware / support costs Data Warehousing Positives • Greater depth and breadth • Easier identification of impacting and impacted measures • A measurement and management toolset • Encourages employee engagement • Multiple data sources • Single version of the truth • Information at the touch of a button
The Chosen Solution – Strata HR Analyser • “Out of box” Kimball-based Datamart solution • Cost effective • Ideal fit to RAC HCM principles • Dimensionally rich • Broad range of measures • “Accounting for People” ready • Web based allows easy access for Line Managers to view reports / metrics
Implementation Timescales Aug 04 Nov 04 Jan 05 Feb 05 Board Approval Install Pilot Live
Solution Functionality • Data mart delivered a broad range of Dimensions and Facts • Track values across time • Provided baseline for all analysis • Low level of granularity • Basis for predictive analysis • HR and absence analysis studio • Easy and advanced reporting studios • Scheduled, stored, secured & audited reports • Scorecards • 3rd Party Data Source capability • Extract Transform and Load (ETL) refresh
Key HR Metrics Measured in automated P&L • Employee Satisfaction • Employee Turnover • Voluntary • Both Voluntary and Non Voluntary • New Employee Retention • Internal Appointments • Absence • Key HR Metrics reviewed annually by HR Board
PLC Targets: Red < 65% Amber 66 – 75% Green > 76% Your Voice Colleague satisfaction is reported at PLC, division and department levels (where available). These statistics are sourced directly from the outcome of the latest “Your Voice” Colleagues Satisfaction Survey, which takes place annually during Q4. Therefore, this figure will only change once per year.
PLC Targets: Red > 15% Amber 10 – 15% Green < 10% Turnover This measures the degree to which colleagues are leaving the organisation. NB: From 2005 the headcount figure used to calculate turnover is an average of the last 12 months, not actual headcount as at the present point in time (as previously calculated). Formula: Actual Number of Leavers in last 12 months * 100 = x % Average of Total Headcount over last 12 months
Frequently Asked Questions Yes/No Are colleagues who transfer internally to other departments counted? No Are temporary colleagues included (who are on our Payroll)? No Are temporary colleagues included (who are employed via an agency?) No Are colleagues on LTS or maternity captured within the headcount figure? Yes Are redundant colleagues classed as leavers? Yes Turnover FAQ’s
PLC Targets: Red > 12% Amber 8 – 12% Green < 8% Voluntary Turnover An additional measure of voluntary turnover introduced to measure the degree to which colleagues have made a conscious decision to leave (as opposed to company enforced e.g. redundancy, restructure, dismissal). Other turnover (i.e. non voluntary turnover) is defined as: Forced Redundancy Dismissal Compromise Agreement Retirement (but not early retirement) Divested / Sold Business
PLC Targets: Red < 85% Amber 85 – 94% Green >= 95% New Colleague Retention This measure replaced the previous measure of “Stability” and is a more accurate way of measuring how many colleagues we are retaining within their first year of service. This measure differs from ‘Stability’ as it captures all colleagues leaving with <1 year’s service as a percentage of purely new starters, as opposed to a measure of the number of colleagues who left with <1 year’s service over the last 12 months as a percentage of the full headcount figure.Formula:- Number of colleagues within the Retention Cohort* 100 = x % Number of Leavers within the Retention Cohort with <1 year service Retention Cohort – This is the number of new starters who joined the organisation within the last 12-24 months. Therefore, for January 2005 the retention cohort will capture all new starters who joined between February 2003 – January 2004 and out of these colleagues, we will then assess how many of them left with <1 year’s service.
Frequently Asked Questions Yes/No Are colleagues who transfer internally to other departments counted? No Are temporary colleagues included (who are on our Payroll)? No Are temporary colleagues included (who are employed via an agency?) No New Colleague Retention FAQ’s
PLC Targets: Red < 35% Amber 35 – 45% Green > 45% Internal Appointments Previously, the only measure for internal appointments captured movement within the Leadership Group. From 2005 onwards, a new measure of “Internal Appointments” has been created to measure the degree to which talent is moving throughout the organisation (sideways as well as upwards).Internal move categories that are included are:- Job Change Inter Company Transfer Promotion Secondment made Permanent Transfer Promotion Formula: Internal moves___________ * 100 = x % Internal moves + New Joiners
PLC Targets: Red 10 days+ Amber 6 – 10 days Green < 6 days Sickness Absence Absence is reported and entered into the HR system one month in arrears. Therefore, as there is no absence information entered for the most recent P&L month at the point the report is run, the absence rolling year period will look back an additional month. Sickness Rate Formula: (Average days, per person, per year) Total number of days sickness over last 12 months = x days Average Headcount over last 12 months Daily Compensation Rate: (Gross Pay + Employers Ni + Employers Pension) / 260 Average Headcount over last 12 months Total Cost of Sickness: Daily Compensation Rate * Average Headcount over last 12 months
Frequently Asked Questions Yes/No Are colleagues on maternity / paternity / adoption leave counted? No Are temporary colleagues included (who are on our Payroll?) Yes Are temporary colleagues included (who are employed via an agency?) No Are colleagues on LTS or maternity / paternity / adoption leave captured within the headcount figure? Yes Is Emergency Family Leave included? No Is compassionate leave included? No Sickness Absence FAQ’s
People P&L Part 2 Production of a supporting document which gives basic monthly information by org unit which forms the basis of the People P&L. This document contains the following: Actual headcount (Colleagues) Number of new starters (Joiners) Number of leavers (Leavers) Number of transfers in Number of transfers out Total number of sickness days (Sickness Days)
People P&L - Benefit Business Cycle Implement Actions: Until this happens there are no major business benefits HR in control of accounting for people as an asset, driving benefits from managing colleagues, & contributing to profit margin/bottom line Automated Report Production: Distribution of reports to the line can be automated, but quality of data must be protected in order to protect credibility Produce and distribute reports Review and Analyse Take action HR & Line managers review P&L values. HR provide analysis to seek reasons for P&L issues highlighted. Improvement actions determined. Affects of previous improvement actions reviewed
Financial Benefits Immediate • Automation of P&L (£50k+ savings) Targeted first year benefits • Reduce absenteeism by 1 day per person • Reduce voluntary turnover by 2% Generated > £1m in savings in first year
Operational Benefits • P&L Reports available at all Organisational levels within the business • Speed of delivery • One consistent version of the truth. • Improved the dynamics between HR and the Line. • System enables better review and improvement of HR business processes. • Increased ability to measure management performance. • Improves organisational effectiveness & efficiency. • Empowers local HR administrators to record accurate data.
Link to Performance / Pay • Key HR metrics linked to individual line managers’ key objectives for the year through appraisal process. • HR metrics reviewed annually by HR board with a view to eventually being in the upper quartile compared to other UK based businesses. • People P&L bonus targets for Senior Management Group (SMG) introduced • If members of the SMG did not carry out Appraisals for their reports and 360 degree feedback from their manager no annual pay review was awarded • Plans to attach bonus to all line managers performance were shelved after Aviva takeover
Other Perceived Benefits • Elevation of status of HR in the business. • Adding value • Providing Insight • Making the business more effective • Closer links between HR & Operational units established to support Line management • Greater Education and support for the business • Greater Management accountability • Regular Director reviews • P&L actuals regularly reported throughout the organisation • Greater confidence in the data
Essential Requirements for success • High level stake holder buy in • Active engagement by HR community • Must be Strategy led • All levels of management need to buy in • Clean Data • Simple, effective B.I. tool • Suitably qualified and trained dedicated HR staff to analyse / interrogate the reports
HR Director - PLC Board “HuRBi helps us deliver a comprehensive understanding of HR performance through the use of metrics and benchmarking.” Debbie Hewitt, now MD, RAC
Lessons Learnt • Minimise the customisation of your solution • Ensure data is cleansed initially • Ensure effective and efficient processes are in place to keep data clean • We had the Right tool, but the wrong people • Need for a Core strategic Analytics Team
Questions ? Or Contact paul.rains@transacthr.co.uk www.transacthr.com