Understanding Ecosystem Dynamics: Energy Flow and Nutrient Cycling
This comprehensive overview of ecosystem dynamics explores energy flow through various trophic levels, including primary producers, consumers, and decomposers. It highlights key concepts such as Gross Primary Production (GPP), Net Primary Production (NPP), and Net Ecosystem Production (NEP), explaining how energy is converted to biomass and lost through respiration. The document also delves into critical biogeochemical cycles, including the carbon, nitrogen, and phosphorus cycles, and their interactions with environmental factors such as precipitation and temperature.

Understanding Ecosystem Dynamics: Energy Flow and Nutrient Cycling
E N D
Presentation Transcript
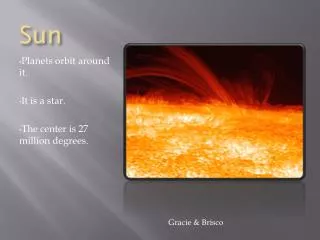
Sun Key Chemical cycling Heat Energy flow Primary producers Primary consumers Detritus Microorganisms and other detritivores Secondary and tertiary consumers
Measures of Production GPP: Gross Primary Production (energy converted to chemical energy of organic compounds in a given amount of time) NPP: Net Primary Production (includes only GPP not used for respiration in the producers) NPP = GPP – Ra NEP: Net Ecosystem Production (total accumulation of biomass) NEP = GPP – RT
Technique 80 Snow Clouds 60 Vegetation Percent reflectance 40 Soil 20 Liquid water 0 400 600 800 1,000 1,200 Visible Near-infrared Wavelength (nm)
Net primary production (kg carbon/m2 • yr) 3 2 1 0
Results 30 Ammonium enriched Phosphate enriched 24 Unenriched control 18 Phytoplankton density (millions of cells per mL) 12 6 0 A B C D E F G Collection site
1,400 1,200 1,000 Net annual primary production (above ground, dry g/m2 • yr) 800 600 400 200 0 20 40 60 80 100 120 140 160 180 200 Mean annual precipitation (cm)
Plant material eaten by caterpillar 200 J 67 J Cellular respiration 100 J Feces 33 J Not assimilated Assimilated Growth (new biomass; secondary production)
Tertiary consumers 10 J Secondary consumers 100 J Primary consumers 1,000 J Primary producers 10,000 J 1,000,000 J of sunlight
Dry mass (g/m2) Trophic level Tertiary consumers 1.5 Secondary consumers 11 Primary consumers 37 809 Primary producers (a) Most ecosystems (data from a Florida bog) Dry mass (g/m2) Trophic level Primary consumers (zooplankton) 21 Primary producers (phytoplankton) 4 (b) Some aquatic ecosystems (data from the English Channel)
Experiment Results Ecosystem type Arctic 80 Subarctic 70 Boreal U R 60 Temperate A O K Q 50 Grassland T Percent of mass lost P J G Mountain 40 S D N F 30 I C M L 20 M H A B E B,C D P G 10 T H,I E,F S 0 O L N U −15 −10 −5 0 5 10 15 J K Mean annual temperature (°C) Q R
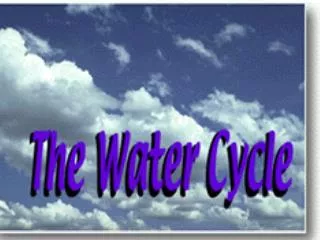
Movement over land by wind Precipitation over land Precipitation over ocean Evaporation from ocean Evapotranspiration from land Percolation through soil Runoff and groundwater The water cycle
CO2 in atmosphere Photosynthesis Photo- synthesis Cellular respiration Burning of fossil fuels and wood Phyto- plankton Consumers Consumers Decomposition The carbon cycle
N2 in atmosphere Reactive N gases Industrial fixation Denitrification N fertilizers Fixation Runoff Dissolved organic N Terrestrial cycling NO3− N2 NO3− NH4 Aquatic cycling Denitri- fication Decomposition and sedimentation Assimilation Decom- position NO3− Fixation in root nodules Uptake of amino acids Ammoni- fication Nitrification NH4 The nitrogen cycle
Wind-blown dust Geologic uplift Weathering of rocks Runoff Consumption Decomposition Plant uptake of PO43− Plankton Dissolved PO43− Leaching Uptake Sedimentation Decomposition The phosphorus cycle
Concrete dam and weir (a) (b) Clear-cut watershed 80 Deforested 60 40 20 Nitrate concentration in runoff (mg/L) Completion of tree cutting 4 3 Control 2 1 0 1965 1966 1967 1968 (c) Nitrate in runoff from watersheds
(b) In 2000, near the completion of restoration (a) In 1991, before restoration
6 5 4 Concentration of soluble uranium (M) 3 2 1 0 0 50 100 150 200 250 300 350 400 Days after adding ethanol (a) Wastes containing uranium, Oak Ridge National Laboratory (b) Decrease in concentration of soluble uranium in groundwater