Check Disk
Check Disk. Disk Defragmenter. Using Disk Defragmenter Effectively. Run Disk Defragmenter when the computer will receive the least usage. Educate users to defragment their local hard disks. Analyze the target volume before you install large applications.
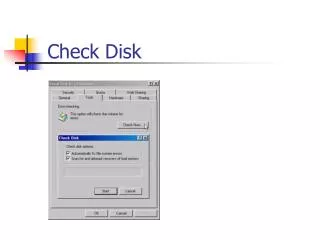

Check Disk
E N D
Presentation Transcript
Using Disk Defragmenter Effectively • Run Disk Defragmenter when the computer will receive the least usage. • Educate users to defragment their local hard disks. • Analyze the target volume before you install large applications. • After you delete a large number of files or folders, analyze your hard disk. • Consider performing scheduled network-wide defragmentation from a central location.
Data Compression • Compressed files can be read by and written to any Microsoft Windows-based or MS‑DOS-based application. • NTFS allocates disk space based on the uncompressed file size.
Selecting an Alternate Display Color • You can select a different display color for compressed files and folders. • You can change the display color by selecting Folder Options from the Tools menu.
Copying and Moving Compressed Files and Folders • Copying a file or folder within an NTFS volume • Moving a file or folder within an NTFS volume • Copying a file or folder between NTFS volumes • Moving a file or folder between NTFS volumes • Moving or copying a file or folder to a FAT volume • Moving or copying a compressed file or folder to a floppy disk
Using NTFS Compression • Select file types to compress based on the anticipated resulting file size. • Do not store compressed files in a compressed folder. • Use a different display color for compressed folders and files. • Compress static data rather than data that changes frequently.
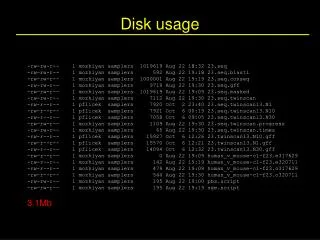
Disk Quotas • Disk quotas track and control disk usage on a per-user, per-volume basis. • Disk quotas have several important characteristics. • You can use disk quotas to perform a number of tasks related to monitoring and controlling hard disk space usage.
Determining the Status of Disk Quotas • You can determine the status of disk quotas in the Properties dialog box for a disk. • The traffic light colors indicate the status of disk quotas.
Enforcing Disk Quotas • You can configure the disk space limit and the warning level for one or more specific users. • You can monitor usage for all users who have copied, saved, or taken ownership of files and folders in a volume. • Volume usage is tracked for all users owning files on a volume where the disk quota system is active.
Guidelines for Using Disk Quotas • If necessary, log on as Administrator to install additional Microsoft Windows 2000 components and applications. • You can monitor hard disk usage and generate hard disk usage information without preventing users from saving data. • Set more restrictive default limits for all user accounts, and then modify the limits if necessary. • Set disk quotas on shared volumes to limit storage for users. • Delete disk quota entries for users who no longer store their files on a volume. • Remove files before deleting a quota entry for a user account.
Management Systems and Agents • The network management station (NMS) does not have to run on the same computer as the SNMP agent. • The NMS can request information from SNMP agents. • SNMP agents provide information about activities that occur at the IP network layer and respond to requests for information. • Agents do not originate messages except a trap message that is triggered by a specific event.
Management Information Base (MIB) • A MIB is a container of objects that represent a particular type of information. • All the information that a management system might request is stored in various MIBs. • A MIB defines values for each object it contains. • Each object in a MIB has a unique identifier that contains information.
SNMP Service Properties • You can configure how the SNMP service starts, logs on to the system, and recovers from an abnormal termination of the service or operating system. • You can specify a display name, description, startup type, and start parameters. • The Dependencies tab provides a list of services that depend on the SNMP service and those that the SNMP service depends on.
SNMP Agent Properties • The SNMP agent provides the related management system with information on activities that occur at the IP network layer. • You can configure the agent properties on the Agent tab of the SNMP Service Properties dialog box. • The Agent tab lists the services that you can select.
Trap Properties • SNMP traps can be used for limited security checking. • You can configure trap destinations on the Traps tab of the SNMP Service Properties dialog box.
Security Properties • Send authentication traps • Accepted community names • Community rights • Accept SNMP packets from any host • Only accept SNMP packets from these hosts
Event Viewer • SNMP error handling has been improved in Windows 2000. • Improved error handling is integrated with Event Viewer. • Use Event Viewer if you suspect a problem with the SNMP service.
WINS Service • When querying WINS server MIBs, you might need to increase the SNMP time-out period. • If some WINS queries work and others time out, increase the time-out period.
IPX Addresses • An Error message occurs when the IPX address has been entered incorrectly. • The SNMP service does not recognize an address with a comma or hyphen between the network number and Media Access Control (MAC) address. • The address used for an IPX trap destination must follow the IETF defined 8.12 format.
System Monitor Snap-In • Performance Monitor has been replaced by System Monitor. • The System Monitor snap-in allows you to perform a number of tasks. • You can collect and view extensible data about the usage of hardware resources and the activity of system services. • You can define the data that you want the graph to collect.
Monitoring System and Network Performance • Network activity can influence system performance. • System Monitor enables you to track network and system activity. • You should use specific counters as part of your normal monitoring configuration. • Monitoring network activity involves examining performance data at each network layer. • You should begin with the lowest-level components and work your way up. • Establish a baseline for network performance.
Disk Objects and the Diskperf Utility • Two primary disk objects contain counters in System Monitor: PhysicalDisk and LogicalDisk. • The physical disk performance counters are enabled, and the logical disk performance counters are disabled. • Use the Diskperf utility to enable and disable the counters. • There is a small performance cost for running these counters.
Collecting Performance Data • Collect performance data automatically from local or remote computers. • View logged counter data or export the data.
Using the Performance Logs and Alerts Snap-In • Collect data in a comma-delimited or tab-separated format. • View counter data during collection and after collection has stopped. • Define start and stop times, file names, file sizes, and other parameters. • Manage multiple logging sessions from a single console window. • Set an alert on a counter.
Recording Performance Data • Start and stop logging. • Create trace logs. • Define a program that runs when a log is stopped. • Configure additional settings for automatic logging.
Introduction to Network Monitor • Tracks network throughput in terms of captured network traffic • Monitors the network data stream on the local network segment • Can capture all local traffic or a subset of frames • Captures only those frames sent to or from the local computer • Uses a network driver interface specification (NDIS) feature to copy all frames to its capture buffer
Installing Network Monitor Tools • Network Monitor Tools include the Network Monitor snap-in and the Network Monitor driver. • These tools are not installed by default. • You can use the Add/Remove Programs utility in Control Panel to install the Network Monitor Tools.
Network Monitor Performance Issues • Network Monitor creates a memory-mapped file for its capture buffer. • Although you cannot adjust the frame size, you can store only part of the frame. • You can run Network Monitor in the background to reduce the amount of system resources necessary to operate the program.
Overview of Task Manager • Task Manager provides information about programs and processes running on your computer. • You can use Task Manager to monitor key indicators of your computer’s performance. • The Task Manager interface contains three tabs: Applications, Processes, and Performance. • You can update Task Manager by clicking Refresh Now on the View menu.