Financial Ratios
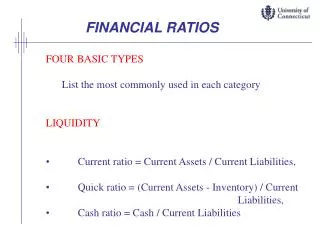
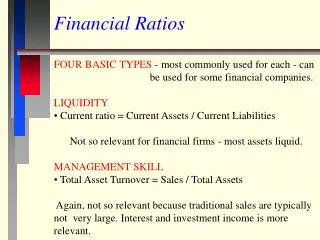
Financial Ratios. FOUR BASIC TYPES - most commonly used for each - can be used for some financial companies. LIQUIDITY Current ratio = Current Assets / Current Liabilities Not so relevant for financial firms - most assets liquid. MANAGEMENT SKILL

Financial Ratios
E N D
Presentation Transcript
Financial Ratios • FOUR BASIC TYPES - most commonly used for each - can be used for some financial companies. • LIQUIDITY • Current ratio = Current Assets / Current Liabilities • Not so relevant for financial firms - most assets liquid. • MANAGEMENT SKILL • Total Asset Turnover = Sales / Total Assets • Again, not so relevant because traditional sales are typically not very large. Interest and investment income is more relevant.
PROFITABILITY • Operating profit margin = Operating Profit/Sales • Return on Revenues = Net Income (or EBIT)/Tot. Assets • Return on Assets = Net Income (or EBIT)/Total Assets • Return on Equity = Net Income/Equity • These are measures of top-line profitability and bottom-line profitability, respectively. Similar for financial firms. • FINANCIAL RISK • Debt Ratio = Debt / Assets • Times Interest Earned = Net Operating Income / • Interest Expense • Leverage and interest-paying ability - used for financials.
Depository Institutions - Banks, S&L, Credit Unions • Financial Statements • National-charter banks must submit uniform accounting statements to the Comptroller of the Currency. • State charter banks submit accounting statements to their state regulator. • LIQUIDITY RISK - different than typical liquidity ratios • Liquidity ratio = (Cash+short-term securities)/Assets • Loans to Deposits = Loans/Deposits • Deposits Times Capital = Deposits/Equity • A mixture of profit potential and risk measures.
MANAGEMENT EFFICIENCY • Earning Assets to Total Assets = Assets-(Cash+Fixed Assets+Non-earning Deposits) / Total Assets • Burden = (Noninterest Exp.-Nonint. Inc.)/Tot. Assets • Efficiency = Nonint. Exp./(Nonint. Inc. + Net Int. Inc.) • Asset Utilization = Total Operating Income / Total Assets • PROFITABILITY • Interest Margin to Earning Assets = (Interest Income-Interest Expense)/Earning Assets • Profit Margin = Net Income/Total Operating Income • Return on Earning Assets = Net Income/Earning Assets • Return on Equity = Net Income/Equity
FINANCIAL RISK • Loan Loss Coverage = (Pretax Income+Loss Provisions) /Net Charge-offs • Provisions to Charge-offs = Loss Provisions/Net Charg. • Loss Allowance to Loans = Loss Allow./Loans • Equity to Assets = Equity / Total Assets • Other issues important to financial analysis of banks • Examine assets for risky asset types (LDC debt, related party loans, allowance for loan loss etc.). • Examine shareholder equity for unrealized gains/losses.
Loan Loss Reserves (part of the common equity account) should be sufficient to meet actual and potential losses. • Review footnotes and management discussion for disclosure of non-performing assets- observe trend. • Review footnotes for data on Off-Balance Sheet Activities which can add risk and profits. • Review trend in demand and time deposits - these are low-cost sources of funds. • Examine “Other Income” typically from services - this income is more stable and desirable than interest income.
Making Loans and Reserving for Losses Versus Guarantees • Financial firms, particularly banks, can make risky loans or provide loan guarantees and both are conceptually the same. • Risky loan value = risk-free value + loan guarantee value • When a loan is made, the bank earns interest above the risk-free rate. The premium above the risk-free rate is a premium for bearing risk as well as compensation for analyzing the and monitoring the borrower’s financial condition. • Loan rate = risk-free rate + risk premium and compensation
Effect of Loans vs. Guarantees on Financial Statements • 1. The effects of loans - transparent. • The loan appears as an asset on the balance sheet. • A loan loss reserve appears as a contra-asset that reduces the loan value by an amount to cover the expected loss on the loan - a risk measure. • Interest is collected periodically and appears on the balance sheet. • 2. The effects of loan guarantees - opaque • Off-balance sheet “intangible” liability - no contingent liability is booked. Footnote should provide some info. • Large up-front fee may appear immediately on income statement or periodic fee shows up over time.
3. The cash payment for the guarantee goes to the cash account and a portion of the payment appears as a reserve for default and the rest goes to equity. The size of the reserve is supposed to be commensurate with risk of the borrower. • 4. Problems with guarantees • Guarantor may reserve too little when loan is not on balance sheet. • If reserve is set properly, competitor lenders are able to see the value you place on particular customer’s creditworthiness.
Insurance Companies • FINANCIAL STATEMENTS • State insurance regulators require annual reports based on statutory accounting practices (SAP). • Reports are similar across states and focus on the balance sheet to help assure solvency for policyholders. • A.M. Best provides “Best’s Insurance Reports” which rate insurance company financial strength. • Ratios used by best include operating, profitability, leverage, liquidity ratios - specific to insurance type. • Annual reports filed with the SEC follow GAAP.
Insurance Ratios • MANAGEMENT EFFICIENCY • Loss Ratio = Incurred Losses/Premiums Earned • Expense Ratio = (Sales + Service Expenses)/Premiums Earned • Dividend Ratio = Dividends/Premiums Earned • Combined Ratio=Loss Ratio+Expense Ratio-Dividend Ratio • Combined Ratio after Dividends =Loss Ratio+Expense Ratio • If the Combined Ratio after Dividends exceeds 1, then the company must rely on investment income for profit.
Note: Earned premiums are premiums paid on policies with time elapsed - unearned premiums are paid but no time elapsed. • PROFITABILITY • Investment Return =Net Investment Income/Premiums Earned • Operating Ratio = Combined Ratio After Dividends - Investment Return • Overall Profitability = 100 - Operating Ratio • Return on Revenues = Net Income / Revenues • Return on Equity = Net Income / Equity
Other issues in financial analysis of Insurance Companies • Look for significant differences between fair value of investments and their costs or amortized costs. • Check the equity section for unrealized gains (losses). • Check for a deferred policy acquisition cost buildup. • Check that loss reserves grow adequately with insurance in force.
Other Financial Companies’ Ratios and Financial Issues • Other financial companies have more conventional financial statements and one can use the conventional ratios discussed at the beginning of this lecture. • Issues for Securities Companies and Investment Banks • Look for excess leverage using Equity to Assets. • Examine the degree of long or short positions relative to total assets for extreme positions. • Look at the list of securities held for large positions in risky securities. • Is income largely from fees (more stable) or trading?
Issues for Investment Companies - Mutual Fund Managers • Examine • Expense Ratio = Expenses / Operating revenues, or • Expense Ratio = Expenses / Assets Under Management • Marketing Ratio = Marketing Exp. / Operating Revenues. • Management Fee Ratio = Management Fees / Assets Under Management • Many of the traditional ratios apply also.
Issues for Finance Companies • Examine • Expense Ratio = Expenses / Operating revenues • Loans to Equity = Loans / Equity • Return on Revenues = Net Income / Revenues • Can be treated similar to banks in many ways because they provide loans, otherwise, use traditional ratios.
Issues for Real Estate Companies • Focus on funds from operations = Earnings+Depreciation+Differed Taxes. • Consider current value of real estate as market or discounted future income value, not book value. • Short-term or variable rate debt used to fund real estate increases earnings risk.
Dupont Analysis - ROE ROE = (Net Income/Total Assets) x (Total Assets/Equity) = ROA x (Equity Multiplier) = (Net Inc./Total Operating Income) x (Total Operating Income/Tot. Assets) x (Total Assets/Equity) = (Profit Margin) x (Asset Utilization) x (Equity Mult.) This says that ROE is determined by; (1) how profitable a company’s products are; (2) how well it uses its assets and; (3) how much leverage it has. Net Income components to consider are Interest and Noninterest Income and Expenses, Taxes and Loan Loss Provisions. Financial firms’ tax rates don’t change much because they have few assets to depreciate or write down.
Cash Flow StatementIllustration of Inflows and Outflows • InflowsOutflows • OperationsOperations • Cash Revenues Payment for Supplies • Collection of A/R Wages, Rent, Tax, etc. • InvestmentsInvestments • Sell Securities, Assets Working Capital • From Subsidiaries Capital Investments • FinancingFinancing • Issue Securities Pay Interest & Dividends • Obtain Loan Repay Loans and Bonds • Retire Equity • Handout Cash Flow Statement or show on web.
Ratio Analysis for Fleet Bank • For a ratio analysis, • Analyze at least 3 years to look for trends (1999-1997). • Compare to similar firms (average-$10 Billion Banks). • 199919981997 • % FleetComp.FleetComp. FleetComp. • Lns/Dep 129 97 104 91 95 89 • Burden 1.06 0.97 1.15 1.39 1.30 1.34 • Prov./Ch. 100 100 105 101 86 100 • Int. Marg. 4.31 3.84 4.60 3.76 4.96 3.88 • Eq/Asset 8.37 7.87 9.24 7.86 8.71 7.58 • ROE 13.73 15.97 15.59 13.80 17.69 15.30 • Question: Are there any trends in Fleet’s ratios? • Question: Explain the changes in Fleet’s ROE year-to-year.
The data for this example was taken directly from www.fdic.gov. It also has income statement, balance sheet, ratio and common size statements for banks and thrifts. Similar data can be found at www.ffiec.gov. • Ratios and financial data may also be found in analyst reports at www.investext.com. • For other companies, use EDGAR-ONLINE and find the 10k statements for a company. Click on FDS to get spreadsheets with raw income statement and balance sheet data. Alternatively, use EDGAR at www.sec.gov. These sites also have quarterly data from 10Qs which can be used for more up-to-date analysis. • For some Credit Union Data try www.ncua.gov.
Other Approaches to Financial Analysis • 1. Common Size Statements • All income statement lines expressed as percentages of total revenues. • All balance sheet lines expressed as percentages of total assets. • Compare changes in percentages over time and in comparison to industry (comparable group) average. • For banks and thrifts, both of these are are available at www.fdic.gov. • Handout Financial Statement and Notes or use Web.