Financial Ratios
Financial Ratios. Lecture 6 This lecture is part of Chapter 3: Evaluating a Company’s Performance. Today’s Lecture. Liquidity Ratios Efficiency Ratios Leverage Ratios Profitability Ratios. Liquidity Ratios. Liquidity is a measure of how quickly an asset can be converted to cash.

Financial Ratios
E N D
Presentation Transcript
Financial Ratios Lecture 6 This lecture is part of Chapter 3: Evaluating a Company’s Performance
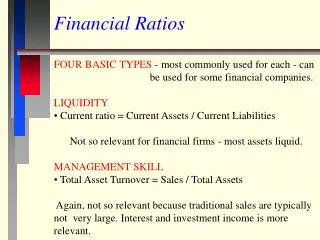
Today’s Lecture • Liquidity Ratios • Efficiency Ratios • Leverage Ratios • Profitability Ratios
Liquidity Ratios Liquidity is a measure of how quickly an asset can be converted to cash. E.g. Accounts receivable = quite liquid Building = not very liquid There are two important liquidity ratios: • Current Ratio • Quick Ratio
Current Assets Current Ratio = Current Liabilities Liquidity Ratios Current Ratio: Under normal circumstances, a company will pay its current liabilities (bills due) with its current assets. The ratio between the two is therefore a good indicator for how well a company can pay its bills.
Liquidity Ratios Current Ratio: A high current ratio means that the company should more easily be able to pay its bills. So that’s good to know if the company owes you money. But … if you’re an investor, too high a current ratio could mean that the company is not using its assets optimally. Think a bit of it like water in a lake. Good to have some, bad to have none and so-so to have too much.
Liquidity Ratios Current Ratio: Most successful businesses have a current ratio of about 1.5 – 2.0. Let’s have a look at the Balance Sheet of Lecture 2 again and add the current ratio.
Adding Ratios Pretty good!
Current Assets - Inventories Quick Ratio = Current Liabilities Liquidity Ratios Quick Ratio: While inventories are necessary for many businesses, they may at times be difficult to sell rapidly. It is therefore useful to also consider a current ratio that takes out inventory from the Current Assets.
Liquidity Ratios Quick Ratio: The quick ratio is sometimes called acid-test ratio. In general, a quick ratio of 1 is considered safe, but in some industries it may be much lower, e.g. in the car industry, 0.2 is common. Let us enter this into the Balance Sheet as well…
Adding Ratios Pretty good too!
Efficiency Ratios • As indicated by the name, efficiency ratios indicate how efficient a company is in its operation. • Two of the most useful “turnover” ratios are: • Inventory Turnover Ratio • Total Asset Turnover Ratio
Inventory Turnover Ratio Cost of Goods Sold = Inventory Efficiency Ratios Inventory Turnover Ratio The inventory turnover ratio indicates how many times the inventory is ‘turned over’ in one year. In other words, it shows how quickly inventory can be sold. Actually, it would be better to replace Inventory with Average Inventory (defined as beginning inventory + ending inventory)/2.
Efficiency Ratios Inventory Turnover Ratio Let us apply this to our Balance Sheet again. Only … the Cost of Goods sold are not on the Balance Sheet. We need to get this item from the Income Statement in Lecture one. In general, a higher Inventory Turnover Rate is good but the number may differ greatly per industry. Dell, e.g, is somewhere above 40 but to many around 4 would already be good.
Adding Ratios Quite meager! But! What happened here???
Interlude – Excel Worksheets Excel can have several named worksheets. A worksheet is basically a spreadsheet on a single page with a name. This means that we can avoid making a complicated single page spreadsheet with an area for the Balance Sheet, and area for the Income Statement and so on. Instead, we can make a separate worksheet for each. In the previous slide, I have added the Income Statement from Lecture 1 as a second worksheet. Cells from other worksheets can be referred to by using the ! mark.
Asset Turnover Ratio Sales = Total Assets Efficiency Ratios Total Asset Turnover Ratio The Total Asset Turnover Ratio shows how well a company is able to generate sales (and hence hopefully profits) from the assets it owns. It is defined as: Again we need to get the Sales from the Income Statement
Adding Ratios Ouch!?
Leverage Ratios • Leverage in business refers to how much debt a company uses to finance its operations. • The idea is that if a company can borrow money at say 7% and then use this money to make a 27% profit, it’s clever to take out the loan. • Two of the most important leverage ratios are: • Total Debt Ratio • Debt to Equity Ratio
Total Debt Ratio Total Debt = Total Assets Leverage Ratios Total Debt Ratio The Total Debt Ratio shows how much of a company’s assets are financed through loans. It is defined as:
Leverage Ratios Total Debt Ratio In general, a low Total Debt Ratio is good with the critical number being 1. Smaller than one means that the company has more assets than debts. Vice versa, larger than one mean that the company has more debts than assets. If this is the case you’d better hope they will not go out of business …
Adding Ratios So so..
Debt Equity Ratio Total Debt = Total Equity Leverage Ratios Debt to Equity Ratio A favorite with many investors. It is similar to the Total Debt Ratio, but rather than dividing by the Total Assets, the Total Debt is divided by the Total Equity. It is defined as:
Leverage Ratios Debt Equity Ratio As with the Total Debt Ratio, a low Debt Equity Ratio is good with the critical number being 1. Smaller than one means that the company has more equity than debts. Vice versa, larger than one mean that the company has more debts than equity. Investors prefer this number since Equity is after all that which belongs to the stock holders.
Adding Ratios So so too..
Profitability Ratios • PROFIT. Of course that’s what business is all about! • Three of the most commonly used profitability ratios are: • Gross Profit Margin (Ratio or Percentage) • Operating Profit Margin (Ratio or Percentage) • Net Profit Margin (Ratio or Percentage) • Note: Though these are ratios they are often just called margin which generally refers to the difference between a certain cost and sales price (taken from the top).
Gross Profit Margin Gross Profit = Sales Profitability Ratios Gross Profit Margin The Gross Profit Margin is the ‘gross’ difference between the actual cost of a product and its sales price. It is defined as: Where Gross Profit = Sales – Cost of Sales
Operating Profit Margin Net Operating Income = Sales Profitability Ratios Operating Profit Margin The Gross Profit Margin is important but does not indicate how much (or whether) the company can make a profit from its running operations. This is indicated by the Operating Profit Margin: Net Operating Income = EBIT (at least usually), the profit after taking all the expenses related to the daily running of the company into account. (Note: Depreciation and Amortization should be included)
Profitability Ratios Operating Profit Margin Since we did not separate Depreciation and Amortization out in our Income Statement, let’s leave this ratio for an exercise.
Net Profit Margin Net Income = Sales Profitability Ratios Net Profit Margin The Net Profit Margin tells you how many cents out of every dollar are actual profit and thus attributable to the shareholders.
Inventory Turnover Ratio Cost of Goods Sold = Current Assets Asset Turnover Ratio Current Assets - Inventories Sales Current Ratio = Inventory Quick Ratio = = Current Liabilities Total Assets Current Liabilities Summary of Ratios Liquidity Ratios Efficiency Ratios
Net Profit Margin Net Income = Sales Operating Profit Margin Gross Profit Margin Gross Profit Net Operating Income Debt Equity Ratio Total Debt Ratio = = Total Debt Total Debt = = Sales Sales Total Equity Total Assets Summary of Ratios Leverage Ratios Profitability Ratios
Key Points of the Day • We have seen how various Ratios can give insight into the performance, liquidity and profitability of a company • The Ratios can be calculated easily with Excel.