Financial Ratios
2. Standardized Financial Statements. Common-Size Balance SheetsCompute all accounts as a percent of total assetsCommon-Size Income StatementsCompute all line items as a percent of salesStandardized statements make it easier to compare financial information, particularly as the company growsThe

Financial Ratios
E N D
Presentation Transcript
1. Financial Ratios
2. 2 Standardized Financial Statements Common-Size Balance Sheets
Compute all accounts as a percent of total assets
Common-Size Income Statements
Compute all line items as a percent of sales
Standardized statements make it easier to compare financial information, particularly as the company grows
They are also useful for comparing companies of different sizes, particularly within the same industry
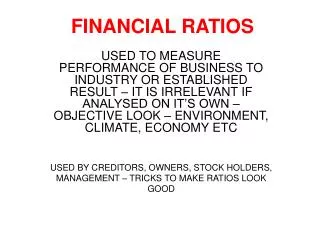
3. 3 Ratio Analysis Ratios also allow for better comparison through time or between companies
As we look at each ratio, ask yourself what the ratio is trying to measure and why that information is important
Ratios are used both internally and externally
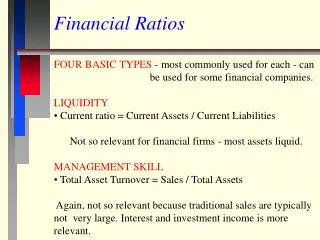
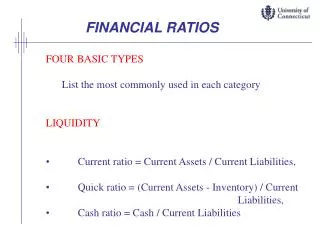
4. 4 Categories of Financial Ratios Short-term solvency or liquidity ratios
Long-term solvency or financial leverage ratios
Asset management or turnover ratios
Profitability ratios
Market value ratios
5. 5
6. 6 Deriving the Du Pont Identity ROE = NI / TE
Multiply by 1 and then rearrange
ROE = (NI / TE) (TA / TA)
ROE = (NI / TA) (TA / TE) = ROA * EM
Multiply by 1 again and then rearrange
ROE = (NI / TA) (TA / TE) (Sales / Sales)
ROE = (NI / Sales) (Sales / TA) (TA / TE)
ROE = PM * TAT * EM
7. 7 Using the Du Pont Identity ROE = PM * TAT * EM
Profit margin is a measure of the firm�s operating efficiency � how well does it control costs
Total asset turnover is a measure of the firm�s asset use efficiency � how well does it manage its assets
Equity multiplier is a measure of the firm�s financial leverage Improving our operating efficiency or our asset use efficiency will improve our return on equity. If the TAT is low compared to our benchmark, then we can break it down into more detail by looking at inventory turnover and receivables turnover. If those areas are strong, then we can look at fixed asset turnover and cash management.
We can also improve our ROE by increasing our leverage � up to a point. Debt affects a lot of other factors, including profit margin, so we have to be a little careful here. We want to make sure we have enough debt to utilize our interest tax credit effectively, but we don�t want to overdo it. The choice of leverage is discussed in more detail in chapter 13.Improving our operating efficiency or our asset use efficiency will improve our return on equity. If the TAT is low compared to our benchmark, then we can break it down into more detail by looking at inventory turnover and receivables turnover. If those areas are strong, then we can look at fixed asset turnover and cash management.
We can also improve our ROE by increasing our leverage � up to a point. Debt affects a lot of other factors, including profit margin, so we have to be a little careful here. We want to make sure we have enough debt to utilize our interest tax credit effectively, but we don�t want to overdo it. The choice of leverage is discussed in more detail in chapter 13.
8. 8 Payout and Retention Ratios Dividend payout ratio (�1 - b�) = Cash dividends / Net income
1.20 / 3.92 = .3061 or 30.61%
Retention ratio (�b�) = Addn. to R/E / Net income = (EPS � DPS) / EPS
(3.92 � 1.20) / 3.92 = .6939 = 69.39%
Or: Retention ratio = 1 � Dividend Payout Ratio
1 - .3061 = .6939 = 69.39% Note that these ratios can be computed either on a per share basis or on an actual basis.Note that these ratios can be computed either on a per share basis or on an actual basis.
9. 9 The Internal Growth Rate The internal growth rate tells us how much the firm can grow assets using retained earnings as the only source of financing.