Download
1 / 22
220 likes | 426 Vues
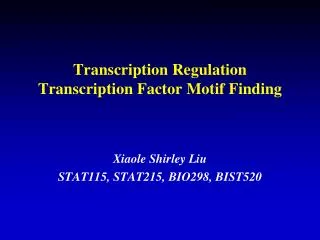
Transcription Regulation. Zhiping Weng Nathan Trinklein Mark Gerstein Ross Hardison Mike Snyder. Area 1a: Define Regulatory Regions. How do we integrate the information in dozens of ChIP-chip tracks to best define regulatory regions?

E N D
Transcription Regulation Zhiping Weng Nathan Trinklein Mark Gerstein Ross Hardison Mike Snyder
Area 1a: Define Regulatory Regions • How do we integrate the information in dozens of ChIP-chip tracks to best define regulatory regions? • Do some regulatory regions function only in specific cell lines? • Can we compile a set of high-confidence novel regulatory regions? • Do factors bind to overlapping or neighboring regions of the genome?
Current Status in Area 1a (Defining Regulatory Regions) • Z-score based integration (Stanford) • Naïve Bayes integration based on an annotated set of promoters and non-promoters (BU) • Intersection and Union of tracks binarized by labs that generated the data
Z-score-based Integration: • Convert each track to Z-score • Sum Z-scores across all tracks • Permute each track to estimate the P-value of Z-score-sum Nathan Trinklein, Shelley Force Aldred, Myers Lab, Stanford
Naïve Bayes Integration • Binarize each track against a set of annotated promoters and non-promoters • Use the Bayes formula to compute the posterior probability that a region is promoter given the measurements in all (or a subset) of tracks
Performance of Example Single Tracks & All Tracks Combined Anason Halees, Ulas Karaoz, Weng Lab, BU
TFIIB-R TFIIB-R SIRT1 SIRT1 RARecA RARecA PU1 PU1 Pol2 Pol2 PIC PIC P300 P300 HisH4 HisH4 H3K27T H3K27T CTCF CTCF CEBPe CEBPe CEBPa CEBPa Brg1 Brg1 PIC PIC PU1 PU1 Pol2 P300 Pol2 Brg1 P300 Brg1 SIRT1 SIRT1 CTCF HisH4 CTCF HisH4 TFIIB-R TFIIB-R CEBPa CEBPe H3K27T CEBPa CEBPe H3K27T RARecA RARecA Heat Map Representation of the Entropy Measurements of Motif Site Clustering Query:experimental sites Target: experimental sites Query: experimental sites Target: simulated sites Jill Cheng, Gingeras Lab, Affymetrix
Area 1b: Correlate Regulatory Regions with Genes / genes / Novel TARs-Transfrags • Novel TARs – transcriptionally active regions outside of gene annotations (supported by 5’-CAGE/ditags). • Examining regions (-2 kb ~ 0.2 kb). • * Expected observations by simulation.
TAF1 Sites Near 5’ end of Genes or Novel TARs count Distance to 5’ of a gene (bp) Distance to 5’ of a TAR (bp) • Novel TARs – transcriptionally active regions outside of gene annotations and supported by 5’-CAGE/Ditags. Deyou Zheng, Joe Rozowsky, Gerstein Lab, Yale
Area 2&3: Motifs • Which DNA motifs distinguish regulatory regions from non-regulatory regions? • Can the content of motifs improve the prediction of expression levels of reporter genes?
y = 22.442x + 33.94R2 = 0.3391 CpG Content Allhigh Allmedium Low Allzero JEGU87zero Mixed
Motifs Help Prediction of Expression • Goodness of fit is highly dependent on cell line. • CRL1690 shows the most improvement • SNU182 performs the worst. Jane Lin, Ulas Karaoz, Heather Burden, Weng Lab, BU
Area 4: Evolutionary Conservation of Regulatory Regions Hardison Lab, Penn State
Area 5: Platform Comparison Summary - Three Studies In Progress 1) PCR vs high-density oligos (maskless/ several protocols) STAT1 (Yale) 2) PCR vs high-density oligos histone modification (UCSD) 3) PET (Singapore) vs high-density oligo (Chromo 21/21, Affymetrix)
Area 5 Platform Comparison Conclusions • Each platform yields a different spectrum of positives. • Maskless arrays show better resolution than the PCR array, but PCR array may tile regions missing from Maskless arrays due to repeat masking of oligos. • Validation is in Progress to Determine Which Platform Has Higher Specificity and Sensitivity
Intersections of STAT1 Hits Four Protocols/StudiesThreshold: if two hits touch at all between each pair of the lists
+ – H + – H + – H STAT1 ChIP Hits in a cluster of cytokine receptor genes: comparison among four platforms UCSD PCR array 50mer every38 50mer every50 36mer every36 (no PCR assay data yet for 5´ end of IFNGR2)
p53 ChIP-PET vs p53 ChIP-chip on chromosome 21&22 High confident p53 binding sites identified by ChIP-PET and ChIP-chip The 13 p53 binding loci identified by 5 PET-3+ clusters and 8 PET-2 clusters containing p53 motif. The 3 Affy p53 loci that are overlapped with PET clusters The 4 Affy p53 loci that did not overlap with PET clusters but contained p53PET motif
Interesting Biology? • Suz12 correlates with H3K27me3 in HeLa, and highly duplicated regions of the genome • Stat1 correlate highly with NHGRI DNase sites • E2F1 highly enriched in DNase sites • p53-PET is not highly enriched in any of the tracks, promoters, conserved regions, but is most enriched in motifs. • None of the Affy factors are enriched with DNase HS Yutao Fu, Anason Halees, Ulas Karaoz, Weng Lab, BU
E2F1 Summary Approximately 300 E2F1 binding sites are in the ENCODE regions E2F1 binds mainly to core promoters Most promoters that are bound by Pol II are also bound by E2F1 Most E2F1 binding sites differ from the consensus site Most E2F consensus sites (TTTSSCGC) are not bound in vivo Most E2F1 binding sites are not cell-type specific (HeLa vs MCF7) Mike Singer, Kyle Munn, Nan Jiang, Todd Richmond and Roland Green of NimbleGenSystems, Inc. Matt Oberley, David Inman, Mark Bieda, Shally Xu and Peggy Farnham from UC Davis
AcH3 meH3K4 Class IV Class I Class III Class II Functional relationship between histone modifications and gene activity Kim TH, Barrera LO, Zheng M, Qu C, Singer MA, Richmond TA, Wu Y, Green RD, Ren B. Nature. 2005.
Activities at This Workshop 1a: Integrate regulatory information 1a: Compare and correlate binding sites of regulatory elements 1b: Compare regulatory regions with transcription data (known genes, novel regions, pseudogenes) 2&3: Motif analysis of binding sites 4: Compare regulatory regions with conservation and variation