Unveiling Earthquake Patterns: Long-Term Trends vs. Short-Term Changes
Explore the evolution of earthquake occurrence over time using statistical analysis. Findings suggest varying trends in major and great earthquakes annually. Evaluate seismic data and consider preparedness strategies.

Unveiling Earthquake Patterns: Long-Term Trends vs. Short-Term Changes
E N D
Presentation Transcript
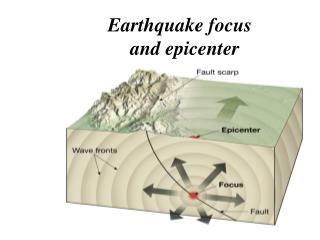
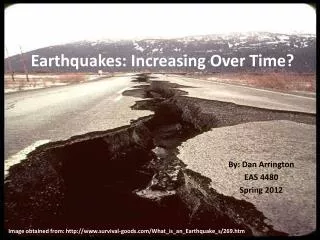
Earthquakes: Increasing Over Time? By: Dan Arrington EAS 4480 Spring 2012 Image obtained from: http://www.survival-goods.com/What_is_an_Earthquake_s/269.htm
Background Information • Richter Scale • Measures magnitude • Energy released follows log scale: log Es = 4.8 + 1.5Ms Es is the energy released in joules. Ms is the magnitude of the earthquake. Source: http://en.wikipedia.org/wiki/Richter_magnitude_scale
Why is it important? • Earthquakes can be deadly and cause widespread damage. Haiti – Magnitude 7.0; 200,000+ Deaths Japan – Magnitude 8.9; 10,000+ Deaths Source: http://disastersstrike.blogspot.com/2011/03/haiti-compared-to-japan.html Es = 1.995 x 10¹⁵ J Es = 1.413 x 10¹⁸ J
It’s About Location • The San Andreas Fault Zone is well known • The New Madrid Fault Zone is much larger • It would be a good idea to make some assessments. A few things to consider are: • Awareness of geographic location • Enforcement of building codes • Implementing warning systems Source: http://endoftheamericandream.com/archives/is-the-new-madrid-fault-earthquake-zone-coming-to-life
Data • I looked at long term and short term data. I wanted to see if the numbers of earthquakes per year are increasing over time. • The long term data spans a century, from 1900-1999. I compared the first half to the second half of the century. • The short term data compares 20 year increments, 1970-1989 and 1990-2009.
Long Term Procedure • For the 100 years of data, I looked at major (7 to 7.9) to great (8+) earthquakes only. This is because before the 1930’s the catalog is only complete down to magnitude 7. • I plotted the data to look at trends. Then I did a least squares regression, reduced major axis regression, and principal component regression. I also calculated the correlation coefficient using the corrcoef() function and bootstrap method. • I also tested for normality of the residuals using the chi-squared test. If normal, I could apply the F-test to see if the data has equal variances. If equal, I could apply the Student’s t-test to see if the means of the data are equal.
Long Term Results 1943: 32 Magnitude 7+ Earthquakes 1960: 14 Magnitude 7+ Earthquakes
Long Term Results (cont.) pLSQ = -0.1682 pRMAR = -0.8066 pPCR = -0.4031 Total Earthquakes, 1950-1999: 701 Total Earthquakes, 1900-1949: 852
Long Term Results (cont.) 95% Confidence rlow = -0.4601 rhigh = 0.0742 Result Insignificant Small Correlation Using corrcoef() r = -0.2085 p = 0.1462 Mean r = -0.2090
Long Term Results (cont.) • Chi-squared value: 14.9340 • Critical Chi-squared value:14.0671 • Data doesn’t follow a normal distribution. • F-test can’t be applied • Student’s t-test can’t be applied
Short Term Procedure • I looked at major to great earthquakes and plotted the data. I did all of the same regressions here as I did for long term. • I calculated the correlation coefficient using the corrcoef() function and bootstrap method. • Finally, applied the Chi-Squared test to check for normality and see if other tests could be applied.
Short Term Results (cont.) pLSQ = 0.1596 pRMAR = 0.6793 pPCR = 0.2740 Total Earthquakes, 1970-1989: 261 Total Earthquakes, 1990-2009: 297
Short Term Results (cont.) 95% Confidence rlow = -0.2317 rhigh = 0.6136 Result Insignificant Small Correlation Using corrcoef() r = 0.2349 p = 0.3188 Mean r = 0.2150
Short Term Results (cont.) • Chi-Squared value: 8.1197 • Critical Chi-Squared value: 14.0671 • F value: 2.1674 • Critical F value: 2.1683 • h 0 • % Significance for t: 0.0926 • 95% Confidence Interval: [-3.9117 0.3117]
Conclusions • Based on the long term results, there is not an increasing trend in the number of major and great earthquakes per year. • Based on the short term results, however, there seems to be an increasing trend. • Neither long term or short term results have a large correlation. • I feel that the number of major and great earthquakes occurring each year follow a pattern, and trends can be found based on what time periods you compare.
Sources • Data Sources: • http://earthquake.usgs.gov/research/data/centennial.php • http://www.johnstonsarchive.net/other/quake1.html • Other Sources: • http://en.wikipedia.org/wiki/Richter_magnitude_scale • http://earthquake.usgs.gov/learn/faq/?faqID=33 • http://www.survival-goods.com/What_is_an_Earthquake_s/269.htm • http://disastersstrike.blogspot.com/2011/03/haiti-compared-to-japan.html • http://endoftheamericandream.com/archives/is-the-new-madrid-fault-earthquake-zone-coming-to-life