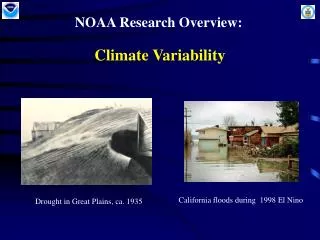
Ocean State Estimation for Studies of Climate Variability
210 likes | 428 Vues
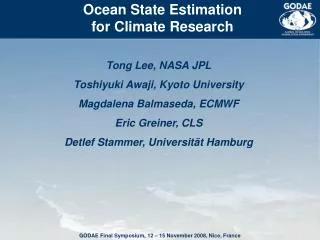
Ocean Surface Topography Science Team Meeting, Hobart, Australia, March 12-15 2007. Ocean State Estimation for Studies of Climate Variability. Tong Lee NASA Jet Propulsion Laboratory, California Institute of Technology.

Ocean State Estimation for Studies of Climate Variability
E N D
Presentation Transcript
Ocean Surface Topography Science Team Meeting, Hobart, Australia, March 12-15 2007 Ocean State Estimation for Studies of Climate Variability Tong Lee NASA Jet Propulsion Laboratory, California Institute of Technology Thanks to many contributors (Wunsch, Verron, Stammer, Ghil, Kohl, Vossepoel, Fukumori, Chen, Kaplan, Hoteit, & Perigaud), and many ocean data assimilation groups (ECCO, SODA, MERCATOR, ECMWF, GFDL, GMAO, CERFACS, INGV, Japan’s K-7 & MOVE-G). (Data assimilation efforts geared more towards short-term ocean nowcast/forecast and S-I predictions are reviewed by Drs. Dombrowsky and Busalacchi) Outline: • A list of examples for various aspects of recent progress. • Decadal change of meridional overturning circulation (MOC) of the N. Atlantic. • Decadal changes of Indo-Pacific circulation: gyre & MOC.
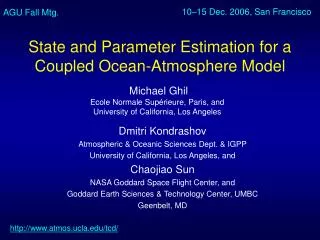
Examples of recent development & applications of ocean data assimilation products for climate-related studies • Assimilation: • Adjoint assimilation at eddy-permitting resolution: Gebbie, Heimbach, & Wunsch (2006), Hoteit, Cornuelle, & Stammer (2006), Mazloff & Wunsch (2007). • Hybrid method based on 4D-VAR & sequential schemes: Robert, Blayo, & Verron (2006a & b) • Estimating mixing coefficients in SSH data assimilation: Vossepoel and van Leeuwin (2006). • Simultaneous state & parameter estimation in coupled O-A model (Ghil et al. 2006). • Estimating open-boundary conditions: Ayoub (2006). • Understanding errors: Kaplan et al. (2004),Ponte, Wunsch, & Stammer (2007), also posters by Kaplan et al. and Oke & Sakov. • OSSE & impact studies: • Kohl & Stammer (2004), Chen, Kaplan, & Cane (2007); also Verron’s talk, posters by Ubelmann et al. and Perigaud et al. • Scientific applications: • Global & regional SSH changes: Carton, Giese, & Grodsky (2005), Wunsch, Ponte, & Heimbach (2007), Garcia et al. (2006), Fenoglio-Marc, Cusche, & Becker (2006), Fukumori, Menemenlis, & Lee (2007). • Gyre & overturning circulations: Atlantic - Kohl (2005), Wunsch & Heimbach (2006), Kohl & Stammer (2007), Cabanes, Lee, & Fu (2007). Pacific & Indian Oceans: Schoenefeldt and Schott (2006), Schott, Wang, & Stammer (2007), Lee et al. (2007). • Mixed-layer heat budget:Kim, Lee, & Fukumori (2004, 2007). • Interdisciplinary: Geodesy - Gross et al. (2005); Ecosystem - Berline et al. (2007).
Impact of Altimeter Sea Level Data Assimilation on Tropical Ocean Modeling and Prediction (Chen, Kaplan and Cane) ECCO-MIT With assimilation ECCO-JPL With assimilation LEFT: Root-mean-square errors between the altimetry and the model simulated sea level anomalies with and without data assimilation, for the linear tropical Pacific model of Cane and Patton and the MIT global OGCM in ECCO1-2 projects. RIGHT: Observed and LDEO model predicted SST and wind stress anomalies in DJF 1997-98. Forecasts were made two seasons in advance, with only FSU winds, FSU winds plus tide gauge (TG) sea level, or FSU winds plus TP sea level for model initialization. Also: Verron’s talk on impact of multi-altimeters; Posters by Castruccio et al. about impact on tropical Pacific currents, by Perigaud’ et al. about impact on coupled model.
Hakkinen (2001) Hakkinen & Rhines (2004): weakening of the subpolar gyre 1st EOF of SSH SSH 1st EOF of SSH from altimeters Meridional Heat Transport 50 60 70 80 90 00 Correlation of time series between SSH-EOF1 and MHT-EOF1 Decadal Variability of North Atlantic Circulation Is the SSH signature in the past decade indicative of a changing subtropical gyre that is coupled to a changing meridional overturning circulation (MOC)?
Inference from synoptic sections at 25N (Bryden, Longworth, & Cunningham 2005): • less northward interior geostrophic flow above 1000 m, but no change in WBC • less deep outflow below 3000 m (~ 5 Sv since 92). How does the MOC in data assimilation products change on decadal & multi-decadal time scales?
Inference from an ECCO ocean data assimilation product Wunsch and Heimbach (2006): only small reduction in northward flow above 1000 m, but stronger mid-depth southward flow and deep northward flow (different from Bryden et al. 2005). Vertical distribution of volume transport (upper) & mid-depth transport time series (lower) Large month-to-month variation: serious issue of potential aliasing for analysis based on infrequent hydrographic sections.
Intercomparison of various ocean data assimilation products: mostly show little reduction in the strength of MOC (upper) and heat transport (lower). Anomaly of MOC strength Anomaly of heat transport Plots provided by Armin Kohl On longer time scales: Kohl and Stammer (2007) found no multi-decadal weakening in the five-decade ECCO assimilation product.
SSH trend for 1993-2000 & 1993-2004 (multi-altimeter AVISO data): the trends from 1992 onwards have been discussed extensively; this talk focuses on the change of decadal tendency during this period.
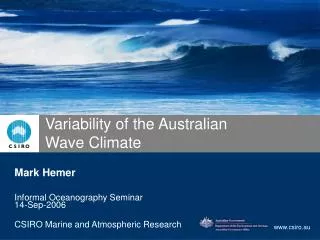
3-year smoothed T/P & JASON-1 SSH trend 1993-2000 Decadal changes of Indo-Pacific Ocean Circulation: coherent variation in many regions with a tendency change around 2000 Lee et al. (2007)
Sensitivity experiments suggest dominant role of wind Solid: wind + buoyancy forcing. Dashed: wind + seasonal buoyancy Lee et al. (2007)
Trends of observed SSH & wind stress curl for 1993-2000: highlight local & remote wind forcing SSH Radiation of eddies Tilted lines reflect Rossby wave effect Forced by Pacific wind Wind stress curl Stronger trade wind contribute to rising SSH in the west; enhanced by off-equatorial curl. Lee et al. (2007)
Remote forcing in the Pacific cause SSH variability off western Australia, resulting in radiation of eddies into the interior: the latter cannot be resolved with coarse-resolution model/assimilation systems Lee et al. (2007)
Co-variability of (1) mean SSH off western Australia (red) & (2) interior eddy-kinetic energy on interannual and decadal time scales (blue). (1) leads (2). Constraining the high-resolution ECCO-2 model by SSH data should improve the representation of the magnitude. Lee et al. (2007)
Comparison of SSH trend (1993-2000): data, simulation, & assimilation Overall improvement by assimilation; used for analysis of gyre changes.
Barotropic streamfunction: mean (left) & change (lower) Mean Weakening Western Subarctic Gyre Strengthening North Central Pacific Gyre Decadal change Strengthening Kuroshio recirculation gyre Strengthening South Pacific Subtropical Gyre Strong cyclonic anomaly
Equatorial trade wind S N Poleward Ekman flow Poleward Ekman flow 10N 10S Subtropical subduction Subtropical subduction Equatorial upwelling Equatorward pycnocline flow Equatorward pycnocline flow 350 m Z The MOC that connects tropical-subtropical Pacific: conceptual, 2-D view of the STC (subtropical cell) McPhaden and Zhang (2002): Analysis of interior hydrographic data suggests a multi-decadal slowdown of the STC (reduced convergence of pycnocline flow into 10S-10N band). McPhaden and Zhang (2004): rebound of STC after 1998.
Pycnocline transports across 9N (Schott et a. 2007) 1993-2000 trend of SSH Anomalous horizontal circulation near WB, causing partial compensation of WB & interior pycnocline flow But STC is 3-D: variation of LLWBC transport counteracts interior pycnocline transport (Lee and Fukumori 2003; Schott et al. 2007). Existing hydrographic data cannot resolve LLWBC variation, leading to over-estimated STC variation. Five-decade ECCO product also show smaller change of interior pycnocline flow & Ekman flow than those reported by McPhaden & Zhang (Schott et al. 2007)
10 Sv 6 Sv Indian Ocean MOC Both the southern cell & cross-equatorial cell carry warm surface water southward & colder thermocline water northward. (ITF enters near 10S, not shown).
1993-2000 trend of zonal wind stress Pacific trade wind Larger divergence of warm surface water Less southward warm Ekman flow Stronger trade wind Weaker trade wind 1993-2000 trend of SSH Indian trade wind More convergence of colder thermocline water Less northward flow of cold water Co-variability of Pacific- and Indian-Ocean trade winds: implicaitons to MOC Lee (2004)
Pacific trade wind Pacific MOC Indian trade wind Indian MOC Decadal variability of MOC strength in the Pacific & Indian Oceans inferred from an ECCO product Also Schott et al. (2006) – weakening cross-equatorial cell in SODA product.
Summary • SSH data continue to be the backbone of many ocean state estimation products. These products • complement observations by synthesizing a diverse source of data with dynamical constraints. • offer a tool to estimate quantities difficult to measure or infer directly from existing observations (e.g., gyre and MOC strength, heat transport, deep variability; budget term balance). • point to areas in need of improvement in observational systems and in models (e.g., WBC, frequency of repeat sections, model resolution, representation of abyssal overflow). • justify sustained observations. • Challenges: • Error estimates; resolution; model physics; balanced assimilation.