Comparing groups
Comparing groups. Research questions. Is outcome of birth related to deprivation? Are surgical and conservative treatments equally effective in resolving schapoid lunate fractures? Does survival from diagnosis to death vary with Dukes’ score?. Issues in comparing groups. Type of data

Comparing groups
E N D
Presentation Transcript
Research questions • Is outcome of birth related to deprivation? • Are surgical and conservative treatments equally effective in resolving schapoid lunate fractures? • Does survival from diagnosis to death vary with Dukes’ score?
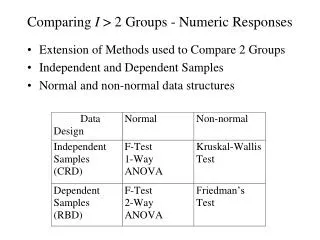
Issues in comparing groups • Type of data • Categorical • Ordered • Unordered • Continuous • Survival • Dependence of observations • Different case • Same cases or matched cases • Number of groups Wot Test?
So – WOT test? • Categorical data • Chi squared • Test of association • Test of trend • Continuous data • Normal (plausibly!) • Two groups • t tests • More than two groups • ANOVA • Survival data • Logrank test
Categorical data • Are males and females equally likely to meet targets to reduce cholesterol? • Test of association • Example 1 • Does the proportion of mothers developing pre-eclampsia vary by parity (birth order)? • Test of trend • Example 2
Hypotheses to be tested • H0: Males and females equally likely to meet targets to reduce cholesterol • H1: Males and females not equally likely to meet targets to reduce cholesterol • Two-sided test • H2: Males are less likely to meet targets to reduce cholesterol • One sided test
The test statistic • Used to decide whether the null hypothesis is: • Accepted • Rejected in favour of the alternative • Value calculated from the data • Significance assessed from known distribution of the test statistic
Example 1: Crosstabulation • Analyse • Descriptive statistics • Crosstabs
Output • Males more likely than females to achieve the target • P<0.001
Testing for trend • When one of the classes is ordinal: • Deprivation score • Age group • Severity of disease • More sensitive Chi-squared tests are available
Example 2: Test of trend Association Trend • Pre-eclamplsia is associated with parity P=0.001 • The linear trend is significant P<0.001
Small numbers Now you’ve wrecked it! • Chi-squared not appropriate: • In a 2 by 2 table (i.e. 1 dof) • Total frequency <20 • Total frequency between 20 and 40, and smallest expected frequency <5 • In tables with more than 1 dof • More than one fifth of cells have expected frequency <5 • Any cell has expected frequency <1 • Yates’ correction for 2 by 2 table (i.e. 1 dof) • When Chi-squared not appropriate • Don’t panic!!!!! • SPSS will sort out these details • Return a message to tell you
Splitting the test statistic • To assess the contribution of one category to overall significance • Corresponding row or column removed • Test statistic recalculated • New test statistic no longer significant • The category concerned is responsible for the effect
Comparing two means • Dependent • Same person • Measured on two occasions • Cholesterol • Baseline • After treatment • Measured on two matched cases • Matching on factors known to affect outcome • Age, BMI • Independent • Different people • Cholesterol at baseline in males and females
Dependent data: Example 3 • Cholesterol measured on two occasions • Baseline • After treatment • Analyse • Compare means • Paired sample t test • Assuming … • Checked distribution • Plausibly Normal
Dependent data Cholesterol reduced after treatment From 6.09 (0.036) to 3.67 (0.200) P<0.001
Independent data: Example 4 • Cholesterol measured at baseline • Males • Females • Analyse • Compare means • Independent samples t test
Independent data • Baseline cholesterol different in males and females • Males 5.83 (0.048) • Females 6.36 (0.051) • P<0.001
Comparing sample variances • Think! • If SDs are unequal, does it make sense to compare means?
Comparing more than 2 groups • ANOVA • Total variance = V • Between groups variance = B • Within groups variance = W • Ratio = B/W • No differences between groups • Ratio = 1 • Higher the ratio • Larger differences between groups
One-way ANOVA • One factor • Smoking status • Never, current, former • BMI category • Underweight, normal, pre-obese, obese • School type • Grammar, Independent, Comprehensive • Tests are: • Global between-group differences • Specific comparisons • e.g. all groups against the first • Contrasts
One-way ANOVA: Example 5 • Is baseline cholesterol related to BMI? • Analyse • General linear model • Univariate
Simple Contrasts • All pairwise combinations • Bonferroni • Specific comparisons • Contrasts • From the previous - Difference • From the first • From the last • Trend • Linear • Non-linear
Two-way ANOVA • Two factors • Time • Post-surgery review • Gender • Ethnicity
Within- and between-subject factors • Within-subjects factors • Side (left, right) • Review (pre-treatment, post-treatment) • Treatment (in a cross-over study) • Between-subjects factors • Gender • BMI
Factor or covariate? • Factors are categorical variables • Otherwise they are covariates
Two-way ANOVA: Example 6 • Is baseline cholesterol related to • BMI? • Gender?
Survival • Time between entry to study and subsequent event • Death • Full recovery • Recurrence of disease • Readmission to hospital • Dislocation of joint
What’s the problem? • Impossible to wait until all members of the study have experienced the event • Some might leave the study before the event occurred • Censored events • Survival time unknown • Times not Normally distributed
Survival methods • Life table • Events are grouped into intervals • One year, three year, five year post-op review • Survival times are inexact • Kaplan-Meier • Time at which event occurred known • Time to mobility during hospital stay • Survival times are exact • Comparing groups • Logrank test
Outcomes from analysis • Life table (life table) • One row for each interval • Survival table (Kaplan-Meier) • One row for each event or censored observation • Time to survival • Mean, median, quartiles, SE • Survival curve • Probability of no event by time t • Hazard curve • Probability of event by time t
Comparing survival in groups • Log-rank • Test of survival experience of all groups • Groups have the same survival curve • Survival is comparable for all groups • Trend • If groups are ordinal a trend test might be appropriate
Cox regression • Used to investigate effect of continuous variables on survival time • Age at diagnosis on time to death • BMI on time to dislocation • Estimates hazard ratio
Data for analysis • Time to survival • Time to event (if event occurred) • Time to end of study (censored event) • Status • Identifies cases in which the event has happened • Can be multiple • 1=Disease free, 2=Recurrence, 3=Death • Group • Treatment regime
Example 7 • Does survival from surgery to death vary with Dukes’ score?