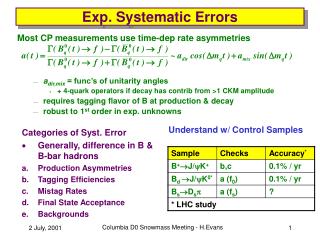
Improving Weather Forecasting by Reducing Systematic Errors in Model Parametrizations
260 likes | 310 Vues
Explore differences in orographic drag parametrization, understand impacts on circulation, and quantify drag effects for climate projections. Enhance forecast accuracy and model skill while reducing systematic errors.

Improving Weather Forecasting by Reducing Systematic Errors in Model Parametrizations
E N D
Presentation Transcript
Activities at CMC to reduce systematic errors in the GEM model Ayrton Zadra RPN/ECCC Joint WGNE/PDEF Meeting JMA, Tokyo, Japan, 9-12 October 2018
But first… some publicity! Joint WGNE/PDEF Meeting JMA, Tokyo, Japan, 9-12 October 2018
COnstrainingORographic Drag Effects (COORDE) • Understanding the effects of resolved and parametrized orographic drag through the COORDE-nation of different modeling groups. • Aims: • Expose differences in orographic drag parametrization formulation between models • Understand impacts of differences in orographic drag parametrizations for modelled circulation • Use high resolution simulations to quantify drag from small-scale orography, typically unresolved in models used for climate/seasonal projections, in order to evaluate orographic drag parametrizations • Understand differences in resolved and parametrized orographic drag across models High resolution orography Low resolution orography Plot shows the impact on the zonal winds from small-scale resolved orography (left) and parametrized orographic drag (right) in the Met Office UM Impact of resolved orography Impact of parametrized orographic drag Potential participants currently include: Environment Canada, DWD, CMA, NOAA/NCEP, KIAPS, Meteo-France, Met Office and ECMWF. Contact Annelize.vanNiekerk@MetOffice.gov.uk and irina.sandu@ecmwf.int for more information or if you are interested in participating van Niekerk et al. (2018), JAMES
“Now back to our regularly scheduled programme…” Joint WGNE/PDEF Meeting JMA, Tokyo, Japan, 9-12 October 2018
Some aspects of a recent R&D project at CMC, of possible interest for WGNE Main goal was to improve forecast skill while • diagnosing the cause and reducing some of the known systematic errors • increasing the model resolution (horizontal and/or vertical) • trying to “unify” the physics packages used by the low and high-resolution systems The approach used involved • challenging the model across resolutions/scales • developing parametrizations less sensitive to vertical resolution • imposing conservation principles (e.g. mass, momentum, energy, water) • participating in (and benefiting from) international projects • expanding R&D strategies
Model Hydrological and Energy Budget Evaluation Project (slides kindly provided by Paul Vaillancourt, RPN/ECCC) • Objective: • evaluate the mean state of all components of the hydrological cycle as well as surface and top of atmosphere energy budgets Climatologies: Trenberth et al. 2009 Stephens et al. 2012 Stephens et al. 2015 Wild et al. 2015
MHEEP - protocol • Run four 13-month 25km free runs (year 2009), starting from MSC analyses staggered by 1day+6 hours. • Daily SST and sea-ice fraction from MSC analyses. • Ensemble annual/seasonal means are produced for: • TOA and SFC radiative fluxes • Latent/Sensible heat SFC fluxes • PR, precipitable water, liquid water path, cloud fraction • Compare to ...
MHEEP – summary graphs Main problems identified: Latent heat fluxes: Largest error in the energy budget. Solar radiation fluxes: Over-estimate of planetary albedo and under-estimate of SW flux at surface. Water residuum: large imbalance between evaporation & precipitation. Summary graph of global annual means Black: Stephens et al. 2012 climatology Red: ERA-int for 2009. Blue: MHEEP control runs
Maps and zonal means: JJA-2009 means of latent heat surface fluxes (W/m2) Zonal means (global, land, ocean) ERA versus Model Top right: ERA interim Bottom right: operational model GDPS
Scores against radiosondes Sensitivity test GDPS-25m: (oper) filtered ME GDPS-25km: non-filtered ME Topography: “To filter or not to filter?” • in early stages of the project, we realized that the topography filter currently used is probably “too aggressive”, leading to an excessively smoothed topography • sensitivity tests revealed that removing the filter (or possibly using a sharper filter) could improve the quality of forecasts N. Hemisphere Winter 2011 72 h (by Michel R.) non-filtered ME(oper) filtered ME
The operational filter (sometimes referred to as the “2-dx filter”) uses a simple 9-point-average of near-neighbor values, with weights indicated in the diagram below: filter weights • The primary goal of the filter was to eliminate wavelengths of size 2-dx (where dx is the grid spacing), but the filter weights are such that even wavelengths up to 30-dx are affected. • In the case of the operational GDPS-25km, this implies a 50% loss in amplitude at ~110 km, and 5% loss at ~800 km. 95% at L ~ 800 km 50% at L ~ 110 km
A new topography filter is now available in GenPhysX. It is also a N-point-average filter, inspired by the so-called “topographydigital filter” previously used (in older versions of GEM) for GU grids, to eliminate topography anisotropies near the poles. • The new filter comes with 2 adjustable parameters that allow the user to control (a) its sharpness and (b) the wavelength at which the amplitude should be reduced by 50% 95% at L ~ 85 km 95% at L ~ 800 km • In the example on the left, still for the operational GDPS-25km, the new filter gives 50% amplitude at 3x25km = 75km, and reaches 95% at ~85 km (instead of the 800 km of the operational filter). 50% at L ~ 110 km 50% at L ~ 75 km
Selected results, combining all model changes* * Mainly changes/improvements in parameterizations, e.g. - revised or new deep/mid-level/shallow convection schemes (all following a “mass-flux” formulation, and based on Kain-Fritsch approach) - energy and water conservation imposed in gridscale condensation scheme - revised PBL scheme (code refactored, new mixing length, improved treatment of BL clouds, dissipative heating included, updates in surface-layer calculations for improved coupling under strongly stable conditions) - improved orographic blocking scheme (code refactored to reduce sensitivity to vertical resolution, dissipative heating included, new ancillary fields) - updated radiative transfer scheme (including new climatologies for ozone, greenhouse gases, and land-surface emissivity)
Zonal means of JJA-2009 means of latent heat surface fluxes (W/m2) ERA versus Experimental model ERA versus Operational model
MHEEP latest config vs GDPS-ops-ctl ERA OPER model EXPE model
MHEEP improvements in SW flux at sfc annual mean of OPER model minus CERES obs annual mean of EXPER model minus CERES obs W m-2
MHEEP improvements in SW flux at TOA annual mean of OPER model minus CERES obs annual mean of EXPER model minus CERES obs W m-2
(slide kindly provided by Ron McTaggart-Cowan,RPN/ECCC) OPER model EXPER model ERA
Impact on Tropical Cyclone forecasts Operationalversus experimentalmodel Verification against best tracks, averages over Summer 2016
Tropical evaluation against ERA5 Operationalversus experimentalmodel error std bias Specific humidity Zonal Wind Temperature Geopotential height
Impact on precipitation over N. America Operationalversus experimentalmodel Precipitation Bias and ETS, 24h accumulation (12-36h lead time)
Evaluation of multi-year means and QBO (slide kindly provided by Jean de Grandpré and Irena Ivanova, ARQI/ECCC) - Comparison of 10-yr model runs (1981-1990, prescribed SST) against reanalyses (Era-Interim). U-Wind 10S-10N 10-yr Time Series JJA U-Wind 10-yr mean DJF U-Wind 10-yr mean ERA Interim EXP model