Economic Models: Production Possibilities Frontier
240 likes | 469 Vues
Economic Models: Production Possibilities Frontier. Illustrating Opportunity Cost, Trade-offs and the cost of idle resources. Today’s Agenda. A simple two-good model of production Production possibilities frontiers Use PPFs to illustrate various concepts Slope of the PPF Examples.

Economic Models: Production Possibilities Frontier
E N D
Presentation Transcript
Economic Models: Production Possibilities Frontier • Illustrating Opportunity Cost, Trade-offs and the cost of idle resources
Today’s Agenda A simple two-good model of production Production possibilities frontiers Use PPFs to illustrate various concepts Slope of the PPF Examples Scarcity Efficiency / inefficiency and unemployment Opportunity cost Economic Growth Concave PPF Linear PPF 2 9/21/2014
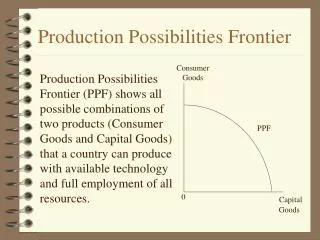
Production Possibilities Frontier • Economic Model • Used to show opportunity cost and trade-offs • Production Possibilities Frontier: • Represents all the different combinations of goods and/or services an economy can produce at maximum efficiency. • It’s called the Production possibilities Frontier because the graph charts the POSSIBLE outcomes of PRODUCTS. • When all productive resources are fully employed.
Let’sexamine guns and butter • Remember, in society the amounts of guns and butter a society has is indirectly proportional. • What does this mean? • Right, as the AMOUNT of one Product goes UP, the AMOUNT of the other Product goes DOWN
Identifying PossibleAlternatives • Classic example has two goods • Guns (representing military needs) • Butter (representing civilian needs) • Economy produces only two goods, but has many alternatives! • The Economy Could… • Use all of its resources to produce 100 units of butter and 30 units of guns (point A)... • ...or it could move resources to more gun production (point B)... • Because the economy has so many options, this is why it is called a “Production Possibilities” frontier!
Fully Employed Resources • Points (A, B) represent maximum outputs if all resources are fully employed. • Ex. Suppose the economy wanted to move to point C, which is more guns and more butter. • What happens? • This is why the graph is called a production possibilities “frontier” because it shows the maximum amount of goods and/or services that can be produced.
Cost of Idle Resources • If not all resources are being employed, then it is impossible for an economy to reach is full potential (capacity). • Ex.<Strike> • A point inside the curve (such as point D) could also be the result of other unused resources • Undeveloped Land • Factories that are not being used
So if the point is on the arch or on the line it tells you what? • If the point is inside the arch that means what? • If the point is outside of the graph that means what?
Attainable and Unattainable All points on or inside the frontier are attainable Point A is attainable, so is point B. In fact B is better! Point C is unattainable C A B 0 Production Possibilities frontier 3,000 Quantity of Computers Produced Quantity of Cars Produced 1,000 9/21/2014 12
Opportunity Cost • The Production Possibilities Frontier also displays opportunity cost and trade-offs. • Ex. Economy wants to move from point A to point B on graph. The opportunity cost of producing the additional 50 units of guns is... • ...the 90 units of butter given up.
The slope determines the opportunity cost of producing good X in terms of good Y • Remember Opportunity cost, is the cost of the THING THAT YOUR ARE GIVING UP!!
Illustrating Concepts Using a Production Possibility Frontier Scarcity Efficiency, Inefficiency and Unemployment Opportunity Cost Economic Growth 9/21/2014 16
Scarcity All points on or inside the frontier are attainable Points A and B are attainable At point C more cars and computers are being produced than at A or B But point C is unattainable. Why? Scarcity Production possibilities are bounded C A B 0 3,000 Quantity of Computers Produced Quantity of Cars Produced 1,000 9/21/2014 17
Start at B1—800 cars and 1500 computers Say we want to increase the number computers to 2000 At point B2 we are producing 2000 computers, but only 600 cars. To increase computer-production by 500, we must give up car-production by 200 The negative slope of the PPF implies that whenever we increase production of one good… …we must give up some of the other good Opportunity Cost 0 3,000 Not Possible! B2 C 2,000 B1 1,500 Quantity of Computers Produced 800 1,000 600 Quantity of Cars Produced 9/21/2014 18
Economic Growth—Long Run Over time an economy can grow More labor and capital Technological progress What happens to the PPF? Shifts outward! Previously unattainable levels of production… …now become attainable 0 4,000 3,000 Quantity of Computers Produced Quantity of Cars Produced 1,000 1,500 9/21/2014 19
Why Does the PPF Bow Outward? PPF does not necessarily have to be concave! But it is reasonable assumption. Why? Because not all resources are equally suited at producing the same good Computer manufacturers make poor car makers and vice versa If more and more resources were diverted into the production of cars say, then even computer manufacturers would find themselves on the automobile assembly line. But their productivity would be low! 9/21/2014 20
Illustrating the Point Suppose we go from A to B. Production of cars is virtually unaffected, but production of computers falls by 750! Computer manufacturers are lousy at making cars PPF is steep Suppose we go from C to D. Production of computers is virtually unaffected, but production of cars decreases by 250! Car makers are lousy at making computers PPF is flat C A 0 As we move up the PPF its slope decreases D 3,000 Quantity of Computers Produced 750 B Quantity of Cars Produced 250 1,000 9/21/2014 21
The slope of the PPF…. …measures the opportunity cost of producing good X (in this case cars) in terms of good Y (in this case computers) If the PPF is linear, then the opportunity cost of producing X in terms of Y is constant at all levels of production This is unrealistic, but linear PPFs are easier to deal with Linear PPFs A B 0 0 3,000 Slope = DY/DX Slope at A… Quantity of Computers Produced DY equals Slope at B DX Quantity of Cars Produced 1,000 9/21/2014 22
Measuring the Opportunity Cost What is the opportunity cost of producing cars? Pick any two points on the PPF… As we move from A to B… DY = -1800 and DX = 600 Slope = -1800/600 = -3 O/C of 1 car is 3 computers A B DY DX 0 0 3,000 Slope = DY/DX 2,400 Quantity of Computers Produced 600 200 800 1,000 Quantity of Cars Produced 9/21/2014 23
Summary A PPF shows all combinations of goods and services that can be produced given available resources and technology The PPF is used to illustrate concepts such as scarcity and opportunity cost The slope of the PPF measures the o/c of producing good X in terms of good Y The curvature of the PPF reflects increasing opportunity cost when substituting one type of production for another 9/21/2014 24