Download
1 / 1
10 likes | 107 Vues
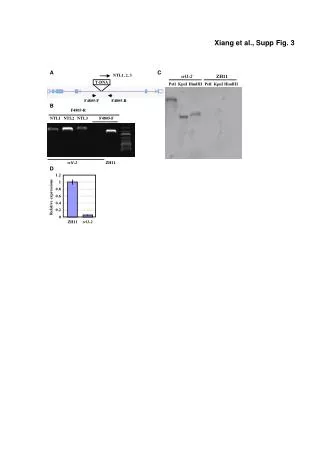
This study analyzes the relative expression levels of NTL1, NTL2, and NTL3 in different genetic lines, specifically SRL1-2 and ZH11, using various restriction enzymes such as PstI, KpnI, and HindIII. Supplementary Figure 3C illustrates the expression profiles with important details on the experimental setup, including T-DNA insertion sites (F4805-F, F4805-R) and the corresponding primers used for amplification. The findings contribute to the understanding of gene regulation in these lines, highlighting significant differences in expression patterns.

E N D
Xiang et al., Supp Fig. 3 C A NTL1, 2, 3 srl1-2 ZH11 PstI KpnI HindIII PstI KpnI HindIII T-DNA F4805-F F4805-R B F4805-R NTL1 NTL2 NTL3 F4805-F srl1-2 ZH11 D 1.2 1 0.8 0.6 Relative expressions 0.4 0.2 0 ZH11 srl1-2