Download
1 / 49
490 likes | 637 Vues
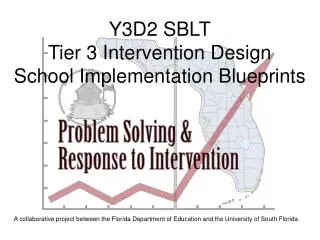
Y3D2 SBLT Tier 3 Intervention Design School Implementation Blueprints. A collaborative project between the Florida Department of Education and the University of South Florida. Advance Organizer. Y3D1 Content Review Skill Assessment Review Integrated T1, T2, T3 Scheduling

E N D
Y3D2 SBLTTier 3 Intervention DesignSchool Implementation Blueprints A collaborative project between the Florida Department of Education and the University of South Florida
Advance Organizer • Y3D1 Content Review • Skill Assessment Review • Integrated T1, T2, T3 Scheduling • Review of Master Schedule & Resource Maps • T3 Intervention Development • Review of Randy - Comprehensive Intervention Plan Columns 1-3 • Tier 3 - Comprehensive Intervention Plan - SBLT Data
Tier 3 Prob. ID & AnalysisEssentials Tier 3 PS extends from previous PS at T1/T2 Don’t assume “lack of effectiveness” Gap analysis used to verify focus of instruction Effective hypotheses requires content experts Question: Why aren’t the T1 & T2 services we provided working for this student? PS model with fidelity at T3
Y3D1 Skill Assessment Review • 1. For which steps did your team successfully apply the problem-solving process? For which steps did the team have difficulty? What factors helped or hindered the team when using problem-solving to address the student’s needs? • 2. Why is it important to calculate the gap between the target student and the expected level as well as the peers and the expected level? What information does it provide? What challenges does your team face when calculating gaps? • 3. Having data on peers for some content areas and skills can be a challenge. What can be done to increase the chances that peer data will be available at problem-solving meetings (e.g., Intervention Assistance Team, School-Based Intervention Team, Student Success Team, RtI Team)? • 4. In what domains (i.e., Instruction, Curriculum, Environment, Learner) were most of your potential reasons (i.e., hypotheses) for why a student is not meeting expectations focused? Were there any domains that were focused on more than others? Were there any domains that weren’t addressed that you believe should have been? • 5. What barriers exist to validating hypotheses by using data during problem-solving meetings? What can teams do to increase the chances that hypotheses can be validated at these meetings?
INTEGRATED TIERS AND SCHEDULING CONSIDERATIONS Assuring Time and Resource
Tiered Model of School Supports & the Problem-Solving Process ACADEMIC and BEHAVIOR SYSTEMS Tier 3: Intensive, Individualized, Interventions. Individual or small group intervention. Tier 2: Targeted, Strategic Interventions & Supports. More targeted interventions and supplemental support in addition to the core curriculum and school-wide positive behavior program. Tier 1: Core, Universal Instruction & Supports. General instruction and support provided to all students in all settings. Revised 10.07.09
Tiers of Service Delivery Problem Identification I II Response to Intervention III Problem Analysis Intervention Design
Features of Integrated Tiers • ALL students receive Tier 1 • Goal is improved academic and behavioral outcomes for all students • Organized around levels of instruction and intervention that are matched to student need
Features of Integrated Tiers (cont.) • Interventions are designed to be coordinated with core curriculum • Organizes educational resources efficiently and effectively • Promotes prevention, early identification, early intervention
Features of Integrated Tiers (cont.) • Student performance needs drive movement between tiers - up and down • Endorse research-based instruction/intervention • Successful implementation relies on highly effective teachers and related services personnel
Features of Integrated Tiers (cont.) • Intensified instruction/intervention is provided to students in direct proportion to their individual needs via Tier 2 and Tier 3
Annual Growth (Tier 1) • All students • Year’s worth of progress for each year of instruction in core subject • Relies on excellent initial teaching • Perpetuates the four-to-six year range of incoming Kindergarten achievement (Fielding, Kerr & Rosier, 2007)
The 6-Year Range (Fielding et al., 2007)
Catch-up Growth (Tier 2/Tier 3) • Students who are behind • Catch-up growth is annual growth PLUS some • Easiest to make EARLY • Primary driver of catch-up growth is increased instructional time (Fielding, Kerr & Rosier, 2007)
Kennewick study: Annual Growth for All Students, Catch-up Growth for Those Who are Behind Lynn Fielding, Nancy Kerr, Paul Rosier—2007 ISBN: 978-0-9666875-2-1 How a school district in Washington met their goal of 90 percent of third graders reading at or above grade level.
Table Talk • What is your school’s approach to assuring that students make annual growth? • What is your school’s approach to assuring that students make catch-up growth?
In most cases… • When students start school behind, they stay behind • Current remedial programs do not catch up lagging students • Annual growth occurs, but very little catch-up growth occurs (Fielding, Kerr & Rosier, 2007)
The most cost-effective way to provide extended reading instruction to virtually all students is to lengthen the standard reading block and make direct instructional time proportional to need instead of available time slots. (Fielding, Kerr & Rosier, 2007)
Increased Instructional Time • Standard amounts of instructional time usually generate annual growth • Students who are behind need extra direct instruction • Increases in instructional time should be proportional to deficiency
Reality Check Students who are three years behind at the end of Kindergarten may require 160-220 minutes of direct instructional time each day during first, second, and third grades to catch up by end of third grade.
Increased Instructional Time • Students who are 3 years behind need more minutes than those who are 1 year behind. • Catch-up growth typically achieved by “running longer” and “running smarter”, not “running faster.” • Direct instructional time does not include practice time, SSR, spelling, etc. (Fielding et al., 2007)
Example from Annual Growth…Catch-up Growth Calculating proportional increases in instructional time: Suppose a state has set its fourth grade reading standard at the 50th percentile. Suppose a student (Tony) finished second grade scoring at the 12th percentile. What will it take to get Tony to the standard?
Example (con’t) Assumption: With normal instructional time (reading block, e.g.), Tony should make one year’s growth/annual growth. Bad news: Without catch-up time, Tony will still be at the 12th percentile at the end of fourth grade.
Example (con’t) • State standard: 50th percentile • Tony’s status: 12th percentile • The difference: 38 points • Point difference divided by 13: 2.9 years (Rule of thumb: On a national level, in elementary reading, each 13 percentile points represents approx. one year’s growth)
Example (con’t) Calculating instructional minutes: Daily minutes for annual 3rd gr. growth: 80 Daily minutes for annual 4th gr. growth: 80 Additional daily minutes to make three additional years of growth: 240 Total 3rd/4th grade daily minutes: 400
Example (con’t) Dividing the total minutes between third and fourth grade shows that Tony needs 200 minutes of direct reading instruction in both third and fourth grades to reach the 50th percentile by the end of fourth grade. Example taken from Annual Growth…Catch-up Growth, Fielding et al., 2007)
Table Talk How would you provide for a student who needs 200 minutes of daily, direct reading instruction in order to make annual and catch-up growth?
Scheduling Considerations Common time for reading blocks vs. Staggered time for reading blocks Pros and Cons?
Example of Staggered Reading Blocks with “Walk and Read”(Sarasota County)
Example of School Level Schedule Volusia County
Kennewick study: • The schools tried more time. It worked. They kept on doing it. • They saw direct correlation between increased instructional time and reading growth. • Improved reading skills positively impacted math scores.
“Students must read well to do well. It matters little what else they learn in elementary school if they do not learn to read at grade level.” (Fielding et al., 2007) What traditional assumptions about the Master Schedule does this viewpoint challenge?
Scheduling Exercise Using your school’s Master Schedule and Resource maps, consider: • Does your schedule allow for an integrated tiered approach? • If the typical school day has 375 minutes, how many of those are spent in direct instructional time at your school?
Scheduling Exercise (con’t) 3) Are changes to the Master Schedule required in order to provide intensified instruction in direct proportion to individual needs at Tiers 2 and 3? If so, what changes are needed?
TIER 3 INTERVENTION DESIGN Designing Individualized, Intensive Instruction
What do we know about Tier 3 Instruction? • Intensive - increase time - narrow focus - reduce group size • Individualized • Student intensely behind and/or notsufficiently responsiveto core and strategic • Small percentageof students
What do we know about Intervention Design and … • its relationship to Problem Analysis? • evidence-based hypotheses? • the progression from prediction statement? • specificity?
Hypothesis Prediction Problem Analysis Intervention Design The problem is occurring because ______________. If ___________ would occur, then the problem would be reduced.
Intervention Selection/Design & Implementation in Context Evaluate Intervention Effectiveness Monitor Progress Analyze the Problem Identify the Problem Implement Intervention Select/Design Intervention J L Timeline
Problem Definition & Problem Analysis have revealed information the problem solving team will use to determine what and how the students need to be taught. The purpose of Intervention is to create an instructional match
More Less Measurement Frequency Measurement Precision Evidence Base Measurement Focus Group Size Depth of Problem Analysis Instructional Time Less More
Principles of Intervention Design Intervention should be designed to: Adjust what is being taught and / or how it is taught
Principles of Intervention Design Intervention is… Planful- procedures to be applied are specified clearly and completely Environmentally Focused- actions taken modify the environmentnot the student Goal Directed- the team writes an ambitious, yet attainable goal statement prior to intervention design
From “Tiered Instruction and Intervention in a Response-to-Intervention Model” by Ed Shapiro Available at: http://www.rtinetwork.org/Essential/TieredInstruction/ar/ServiceDelivery/1