Planning, Running, and Analyzing Controlled Experiments on the Web
690 likes | 896 Vues
Part 1. Planning, Running, and Analyzing Controlled Experiments on the Web . Ronny Kohavi, GM, Experimentation Platform, Microsoft. Slides available at http://exp-platform.com. Amazon Shopping Cart Recs. Add an item to your shopping cart at a website Most sites show the cart

Planning, Running, and Analyzing Controlled Experiments on the Web
E N D
Presentation Transcript
Part 1 Planning, Running, and Analyzing Controlled Experiments on the Web Ronny Kohavi, GM, Experimentation Platform, Microsoft Slides available at http://exp-platform.com
Amazon Shopping Cart Recs • Add an item to your shopping cart at a website • Most sites show the cart • At Amazon, Greg Linden had the idea of showing recommendations based on cart items • Evaluation • Pro: cross-sell more items (increase average basket size) • Con: distract people from checking out (reduce conversion) • HiPPO (Highest Paid Person’s Opinion) was: stop the project • Simple experiment was run, wildly successful From Greg Linden’s Blog: http://glinden.blogspot.com/2006/04/early-amazon-shopping-cart.html
Stress HiPPO • The less data, the stronger the opinions • Whenever you feel stressed that a decision is made without data, squeeze the Stress-HiPPO • Put one in your office to show others you believe in data-driven decisions based on experiments • Hippos kill more humans than anyother (non-human) mammal (really) • Don’t let HiPPOs in your orgkill innovative ideas. ExPeriment!
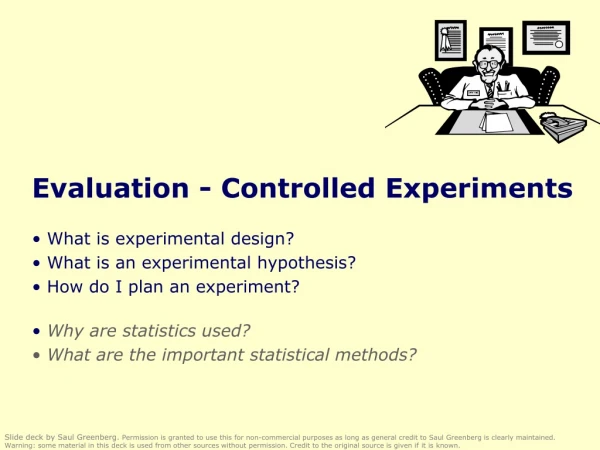
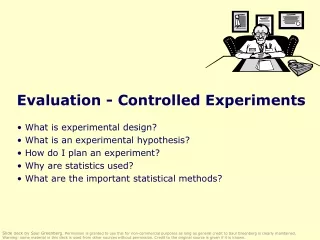
Agenda • Controlled Experiments in one slide • Examples: you’re the decision maker • Culture, OEC (Overall Evaluation Criterion) • Controlled Experiments: deeper dive • Two key messages to remember • It is hard to assess the value of ideas.Get the data by experimenting because data trumps intuition • OEC: Make sure the org agrees what you are optimizing
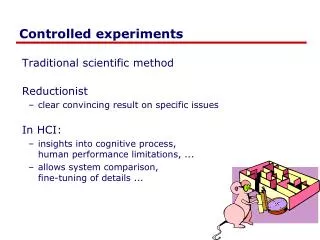
Controlled Experiments in One Slide • Concept is trivial • Randomly split traffic betweentwo (or more) versions • A/Control • B/Treatment • Collect metrics of interest • Analyze • Best scientific way to prove causality, i.e., the changes in metrics are caused by changes introduced in the treatment(s) • Must run statistical tests to confirm differences are not due to chance
Examples • Three experiments that ran at Microsoft recently • All had enough users for statistical validity • Game: see how many you get right • Everyone please stand up • Three choices are: • A wins (the difference is statistically significant) • A and B are approximately the same (no stat sig diff) • B wins • If you guess randomly • 1/3 left standing after first question • 1/9 after the second question
MSN Real Estate • “Find a house” widget variations • Overall Evaluation Criterion: Revenue to Microsoft generated every time a user clicks search/find button A B • Raise your right hand if you think A Wins • Raise your left hand if you think B Wins • Don’t raise your hand if you think they’re about the same
MSN Real Estate • If you did not raise a hand, please sit down • If you raised your left hand, please sit down • A was 8.5% better
Office Online Test new design for Office Online homepage OEC: Clicks on revenue generating links (red below) A B • Raise your right hand if you think A Wins • Raise your left hand if you think B Wins • Don’t raise your hand if you think they’re about the same
Office Online • If you did not raise a hand, please sit down • If you raised your left hand, please sit down • B was 64% worse The Office Online team wrote A/B testing is a fundamental and critical Web services… consistent use of A/B testing could save the company millions of dollars
MSN Home Page Search Box OEC: Clickthrough rate for Search box and popular searches A B Differences: A has taller search box (overall size is the same), has magnifying glass icon, “popular searches” B has big search button • Raise your right hand if you think A Wins • Raise your left hand if you think B Wins • Don’t raise your hand if they are the about the same
Search Box • If you raised any hand, please sit down • Insight Stop debating, it’s easier to get the data
Agenda • Controlled Experiments in one slide • Examples: you’re the decision maker • Culture, OEC (Overall Evaluation Criterion) • Controlled Experiments: deeper dive • Two key messages to remember • It is hard to assess the value of ideas .Get the data by experimenting because data trumps intuition • OEC: Make sure the org agrees what you are optimizing
The Cultural Challenge It is difficult to get a man to understand something when his salary depends upon his not understanding it. -- Upton Sinclair • Why people/orgs avoid controlled experiments • Some believe it threatens their job as decision makers • At Microsoft, program managers select the next set of features to develop. Proposing several alternatives and admitting you don’t know which is best is hard • Editors and designers get paid to select a great design • Failures of ideas may hurt image and professional standing.It’s easier to declare success when the feature launches • We’ve heard: “we know what to do. It’s in our DNA,” and“why don’t we just do the right thing?”
Experimentation Culture • Learn from flat/negative results • Even if an idea failed to improve the OEC, the org learned something. Failing fast is good • “If you're not prepared to be wrong, you'll never come up with anything original” – Sir Ken Robinson (TED 2006) • Deploy the positive experiments: only their sum really matters • To innovate, experiment often • “To have a great idea, have a lot of them” -- Thomas Edison • If you have to kiss a lot of frogs to find a prince, find more frogs and kiss them faster and faster
Do It Wrong Quickly • We work on “the plan,” which isreviewed and approved by execs,then we execute flawlessly (or do we?) • We’re looking to hit the arrow in the center—the bulls-eye • But what if we the game is to score the most points, i.e., the sum of arrow scores. • Shooting three arrows may be muchmore effective
Do It Wrong Quickly (2) • Netflix considers 90% of what they try to be wrong (p. 240). • What customers do is just as important as what they say.Measuring the “do” is easier and friendlier than surveying them all the time] • Try the game at http://www.redbooks.ibm.com/ibmpress/ibmpressgame/DIWQ_game.html
Enlightened Experimentation: The New Imperative for Innovation • HBR article by Stefan Thomke (Feb, 2001) • Experimentation lies at the heart of every company's ability to innovate • In the past, testing was relatively expensive, so companies had to be parsimonious with the number of experimental iterations • The electric light bulb, required more than 1,000 complex experiments with filament materials and shapes, electromechanical regulators, and vacuum technologies
Enlightened Experimentation (2) • Essentials for enlightened experimentation • Organize for rapid experimentation • Encourage rapid experimentation • Use small development groups with key people to iterate rapidly • Perform experiments in parallel • Fail early and often, but avoid mistakes • Embrace failure to advance knowledge • Failure can expose important gaps in knowledge • Don't forget the basics: well designed tests with clear objectives • IDEO's “fail often to succeed sooner” • Don't develop expensive sleek prototypes, as you become committed to them before you know if they work.
Enlightened Experimentation (3) • Essentials (CONT) • Anticipate and exploit early information • Front-load to identify problems and provide guidance when it's cheap • Acknowledge trade-off between cost and fidelity. Low-fidelity experiments (costing less) are suited in early exploratory stages • Combine new and traditional technologies • Today's new technology might eventually replace its traditional counterpart, but it could then be challenged by tomorrow's new technology
Failures are Not Mistakes • Article by Thomke, May 2006 • Mistakes refer to the wrong actions that result from poor judgments or inattention; they should be avoided because they produce little new or useful information. • A poorly planned or badly conducted experiment that results in ambiguous data, forcing researchers to repeat the experiment, is a mistake. • Another common mistake is repeating a prior failure or learning nothing from the experience
Failures are Not Mistakes (2) Story about Tom Watson Sr., IBM's founder • A promising young executive involved in a risky new venture, managed to lose more than $10 million while trying to make the venture work • When the nervous man was called into Watson's office, he offered to accept the logical consequence of losing the company such a large amount of money: "I guess you want my resignation, Mr. Watson.“ • Much to his surprise, Watson countered: 'You can't be serious! We've just spent 10 million [dollars] educating you."
Hard to Assess the Value of Ideas:Data Trumps Intuition • It is humbling to see how often we are wrong • Experts are often wrong in many domains • Doctors did bloodletting for centuries until the 1836 when Pierre Louis ran a controlled experiment (randomized clinical trial) • At Amazon, more than half of the experiments failed to show improvement • QualPro tested 150,000 ideas over 22 years • 75 percent of important business decisions andbusiness improvement ideas either have no impact onperformance or actually hurt performance…
Microsoft’s Batting Average • Based on experiments with ExP at Microsoft • 1/3 of ideas were positive ideas and statistically significant • 1/3 of ideas were flat: no statistically significant difference • 1/3 of ideas were negative and statistically significant • Our intuition is poor: 2/3rd of ideas do not improve the metric(s) they were designed to improve! • Every idea was built because someone thought it was a great idea worth implementing (and convinced others) • Humbling, but that’s the value of experimentation
Ronny Kohavi The OEC • If you remember one thing from this talk, remember this point • OEC = Overall Evaluation Criterion • Agree early on what you are optimizing • Getting agreement on the OEC in the org is a huge step forward • Suggestion: optimize for customer lifetime value, not immediate short-term revenue • Criterion could be weighted sum of factors, such as • Time on site (per time period, say week or month) • Visit frequency • Report many other metrics for diagnostics, i.e., to understand the why the OEC changed and raise new hypotheses
OEC Thought Experiment • Tiger Woods comes to you for advice on how to spend his time: improving golf, or improving ad revenue (most revenue comes from ads) • Short term, he could improve his ad revenueby focusing on ads… • But to optimize lifetime financial value(and immortality as a great golf player),he needs to focus on the game • While the example seems obvious,organizations commonly make the mistakeof focusing on the short term
McNamara’s Fallacy • Beware of measuring what is easy instead of what’s important. For example: • Clicks to the beginning of the purchase pipeline rather than actual purchases (you may change the probability of purchase given someone enters the pipeline). • McNamara’s Fallacy: • The first step is to measure what can easily be measured. This is OK as far as it goes. • The second step is to disregard that which can't easily be measured or give it an arbitrary quantitative value.This is artificial and misleading. • The third step is to presume that which can't be measured easily really isn't important.This is blindness. • The fourth step is to say that what can't be easily measured really does not exist.This is suicide.
Agenda • Controlled Experiments in one slide • Examples: you’re the decision maker • Culture, OEC (Overall Evaluation Criterion) • Controlled Experiments: deeper dive • Two key messages to remember • It is hard to assess the value of ideas .Get the data by experimenting because data trumps intuition • OEC: Make sure the org agrees what you are optimizing
Typical Discovery • With data mining, we find patterns, but most are correlational, providing hypotheses for possible causes • Here is one a real example of two highly correlatedvariables
Correlations are not Necessarily Causal • Data for the city of Oldenburg, Germany • X-axis: stork population • Y-axis: human population • What your mother told you about babies and storks when you were three is still not right, despite the strong correlational “evidence” OrnitholigischeMonatsberichte 1936;44(2)
Correlation: Example 2 • True statement (but not well known): Palm size correlates with your life expectancy The larger your palm, the less you will live, on average. • Try it out - look at your neighbors and you’ll see who is expected to live longer But…don’t try to bandage your hands Women have smaller palms and live 6 years longeron average
Advantages of Controlled Experiments • Controlled experiments test for causal relationships, not simply correlations • When the variants run concurrently, only two things could explain a change in metrics: • The “feature(s)” (A vs. B) • Random chance Everything else happening affects both the variants For #2, we conduct statistical tests for significance • The gold standard in science and the only way to prove efficacy of drugs in FDA drug tests
Issues with Controlled Experiments (1 of 2) • Org has to agree on OEC (Overall Evaluation Criterion). • This is hard, but it provides a clear direction and alignment • Some people claim their goals are “soft” or “intangible” and cannot be quantified.Think hard and read Hubbard’s How to Measure Anything: Finding the Value of Intangibles in Business • Quantitative metrics, not always explanations of “why” • A treatment may lose because page-load time is slower.At Amazon, we slowed pages by 100-250msec and lost 1% of revenue • A treatment may have JavaScript that fails on certain browsers, causing users to abandon. If you don't know where you are going, any road will take you there —Lewis Carroll
Issues with Controlled Experiments (2 of 2) • Primacy/newness effect • Changing navigation in a website may degrade the customer experience (temporarily), even if the new navigation is better • Evaluation may need to focus on new users, or run for a long period • Multiple experiments • Even though the methodology shields an experiment from other changes, statistical variance increases making it harder to get significant results.There can also be strong interactions (rarer than most people think) • Consistency/contamination • On the web, assignment is usually cookie-based, but people may use multiple computers, erase cookies, etc. Typically a small issue • Launch events / media announcements sometimes preclude controlled experiments • The journalists need to be shown the “new” version
Best Practice: A/A Test • Run A/A tests • Run an experiment where the Treatment and Control variants are coded identically and validate the following: • Are users split according to the planned percentages? • Is the data collected matching the system of record? • Are the results showing non-significant results 95% of the time? This is a powerful technique for finding bugs and other integration issues before teams try to make data-driven decisions • Generating some numbers is easy • Getting correct numbers you trust is much harder!
Best Practice: Compute Statistical Significance • A very common mistake is to declare a winner when the difference could be due to random variations • Compute 95% confidence intervals on the metrics to determine if the difference is due to chance or whether it is statistically significant • Increase percentage if you do multiple tests (e.g., use 99%) • Idea: run an A/A test in concurrent to your A/B test to make sure the overall system doesn’t declare it as significant more than 5% of the time (great QA)
Best Practice: Ramp-up • Ramp-up • Start an experiment at 0.1% • Do some simple analyses to make sure no egregious problems can be detected • Ramp-up to a larger percentage, and repeat until 50% • Big differences are easy to detect because the min sample size is quadratic in the effect we want to detect • Detecting 10% difference requires a small sample and serious problems can be detected during ramp-up • Detecting 0.1% requires a population 100^2 = 10,000 times bigger • Abort the experiment if treatment is significantly worse on OEC or other key metrics (e.g., time to generate page)
Run Experiments at 50/50% • Novice experimenters run 1% experiments • To detect an effect, you need to expose a certain number of users to the treatment (based on power calculations) • Fastest way to achieve that exposure is to run equal-probability variants (e.g., 50/50% for A/B) • If you perceive risk, don’t start an experiment at 50/50% from the beginning: Ramp-up over a short period
Randomization • Good randomization is critical.It’s unbelievable what mistakes developers will make in favor of efficiency • Properties of user assignment • Consistent assignment. User should see the same variant on successive visits • Independent assignment. Assignment to one experiment should have no effect on assignment to others (e.g., Eric Peterson’s code in his book gets this wrong) • Monotonic ramp-up. As experiments are ramped-up to larger percentages, users who were exposed to treatments must stay in those treatments (population from control shifts)
Controversial Claims • Run concurrent univariate experiments • Vendors make you think that MVTs and Fractional Factorial designs are critical---they are not. The same claim can be made that polynomial models are better than linear models: true in theory, less useful in practice • Let teams launch multiple experiments when they are ready, and do the analysis to detect and model interactions when relevant (less often than you think) • Backend integration (server-side) is a better long-term approach to integrate experimentation than Javascipt • Javascript suffers from performance delays, especially when running multiple experiments • Javascript is easy to kickoff, but harder to integrate with dynamic systems • Hard to experiment with backend algorithms (e.g., recommendations)
Summary • The less data, the stronger the opinions • It is hard to assess the value of ideas • Listen to your customers • Get the data by experimenting because data trumps intuition • Examples are humbling. More at http://exp-platform.com • Empower the HiPPO with data-driven decisions • OEC: make sure the org agrees what you are optimizing (long term lifetime value) • Compute the statistics carefully • Power, 95% confidence, ramp-up • Stats/details described at http://exp-platform.com/hippo_long.aspx • Experiment often • Triple your experiment rate and you triple your success (and failure) rate.Fail fast & often in order to succeed • Accelerate innovation by lowering the cost of experimenting
Microsoft Support • Support.microsoft.com shows “top issues” • OEC = click-through rate • A shows top issues • B filters top issues toOS & Browser used tovisit site (useragent) • Personalization rarely hurts, but does it help? • Raise your right hand if you think B Wins by over 30% • Raise your left hand if you think B Wins by under 30% • Don’t raise your hand if you think they’re about the same
Microsoft Support • If you did not raise a hand, please sit down • If you raised your left hand, please sit down • B was >50% better Personalization helps more than people think!
Microsoft Confidential MSN UK Hotmail experiment Hotmail module on the MSN UK home page
MSN UK Hotmail experiment A: When user clicks on email hotmail opens in same window B: Open hotmail in separate window Trigger: only users that click in the module are in experiment (no diff otherwise) OEC: clicks on home page (after trigger) • Raise your right hand if you think A Wins • Raise your left hand if you think B Wins • Don’t raise your hand if they are the about the same
UK Hotmail • If you didn’t raise a hand, please sit down • If you raised your right hand, please sit down • For those in the experiment, clicks on MSN Home Page increased +8.9% • <0.001% of users in B wrote negative feedback about the new window
Data Trumps Intuition • The experiment report was sent by the BI/CI team to all multiple teams across the world • Someone who saw the report wrote This report came along at a really good time and was VERY useful. I argued this point to my team (open Live services in new window from HP) just some days ago. They all turned me down.Funny, now they have all changed their minds.
Real Example: MSN Real Estate • “Find a house” widget variations • Overall Evaluation Criterion: Revenue to Microsoft generated every time a user clicks Think which one should win…
MSN Real Estate The widget that performed the best was… the simplest • Revenue increase over control: +9.7% • Interesting note: nobody from MSN Real Estate or Zaaz (the company that did the creative) thought this widget would win