Evaluation - Controlled Experiments
Evaluation - Controlled Experiments. What is experimental design? What is an experimental hypothesis? How do I plan an experiment? Why are statistics used? What are the important statistical methods?.

Evaluation - Controlled Experiments
E N D
Presentation Transcript
Evaluation - Controlled Experiments What is experimental design? What is an experimental hypothesis? How do I plan an experiment? Why are statistics used? What are the important statistical methods? Slide deck by Saul Greenberg. Permission is granted to use this for non-commercial purposes as long as general credit to Saul Greenberg is clearly maintained. Warning: some material in this deck is used from other sources without permission. Credit to the original source is given if it is known.
Quantitative evaluation of systems • Quantitative: • precise measurement, numerical values • bounds on how correct our statements are • Methods • user performance data collection • controlled experiments
Collecting user performance data • Data collected on system use (often lots of data) • Exploratory: • hope something interesting shows up (e.g., patterns) • but can be difficult to analyze • Targeted • look for specific information, but may miss something • frequency of request for on-line assistance • what did people ask for help with? • frequency of use of different parts of the system • why are parts of system unused? • number of errors and where they occurred • why does an error occur repeatedly? • time it takes to complete some operation • what tasks take longer than expected?
Logging exampleHow people navigate with web browsers Tauscher, L. and Greenberg, S. (1997) How People Revisit Web Pages: Empirical Findings and Implications for the Design of History Systems. International Journal of Human Computer Studies - IJHCS, 47(1):97-138.
Logging exampleHow people navigate with web browsers Tauscher, L. and Greenberg, S. (1997) How People Revisit Web Pages: Empirical Findings and Implications for the Design of History Systems. International Journal of Human Computer Studies - IJHCS, 47(1):97-138.
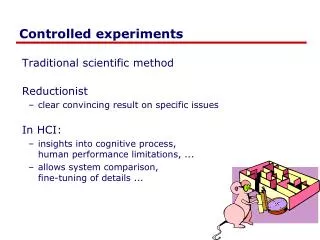
Controlled experiments • Traditional scientific method • Reductionist • clear convincing result on specific issues • In HCI: • insights into cognitive process, human performance limitations, ... • allows system comparison, fine-tuning of details ...
exampleWhich toothpaste is best? Images from http://www.futurederm.com/wp-content/uploads/2008/06/060308-toothpaste.jpg and http://4.bp.blogspot.com/_i2tTNonulCM/R7t3T7qDxTI/AAAAAAAAAB0/JrUU1wJMeFo/s400/ist2_2301636_tooth_paste[1].jpg
File Edit View Insert File New Edit New Open Open View Close Insert Close Save Save exampleWhich menu should we use?
exampleChoosing on-screen keyboards • size • but trades off with screen real estate)
example Choosing on-screen keyboards • Layout • ease of learning by non-typists • touch typing ≠hunt and peck • Qwerty Alphabetic Random • Dvorak
example Choosing on-screen keyboards • Uncoventional layouts Raynal, Vinot & Truillet: UIST’07
example Choosing on-screen keyboards • Device size / input type?
example Choosing on-screen keyboards • Issues • can’t just ask people (preference ≠performance) • observations alone won’t work • effects may be too small to see but important • variability of people will mask differences (if any) • need to understand differences between users • strong vs. moderate vs. weak typists • …
A) Lucid and testable hypothesis • State a lucid, testable hypothesis • this is a precise problem statement • Example 1: There is no difference in the number of cavities in children and teenagers using crest and no-teeth toothpaste when brushing daily over a one month period
File Edit View Insert File New Edit New Open Open View Close Insert Close Save Save A) Lucid and testable hypothesis • Example 2: There is no difference in user performance (time and error rate) when selecting a single item from a pop-up or a pull down menu of length 3, 6, 9 or 12 items, regardless of the subject’s previous expertise in using a mouse or using the different menu types
A) Lucid and testable hypothesis • Example 3: There is no difference in user performance (time and error rate) and preference (5 point likert scale) when typing on two sizes of an alphabetic, qwerty and random on-screen keyboard using a touch-based large screen, a mouse-based monitor, or a stylus-based PDA.
Independent variables • b) Hypothesis includes the independent variables that are to be altered • the things you manipulate independent of a subject’s behaviour • determines a modification to the conditions the subjects undergo • may arise from subjects being classified into different groups
Independent variables • in toothpaste experiment • There is no difference in the number of cavities in children and teenagers using glow-right and no-teeth toothpaste when brushing daily over a one month period • toothpaste type: uses Crest or No-teeth toothpaste • age: <= 11 years or > 11 years
Independent variables • in menu experiment • There is no difference in user performance (time and error rate) when selecting a single item from a pop-up or a pull down menu of length 3, 6, 9 or 12 items, regardless of the subject’s previous expertise in using a mouse or using the different menu types • menu type: pop-up or pull-down • menu length: 3, 6, 9, 12 • subject type (expert or novice)
Independent variables • in keyboard experiment • There is no difference in user performance (time and error rate) and preference (5 point likert scale) when typing on two sizes of an alphabetic, qwerty and random on-screen keyboard using a touch-based large screen, a mouse-based monitor, or a stylus-based PDA. • keyboard type: alphabetic, qwerty, random • size: small, large • input/display: touch/large, mouse/monitor, stylus/PDA
Dependant variables • c) Hypothesis includes the dependent variables that will be measured • variables dependent on the subject’s behaviour / reaction to the independent variable • the specific things you set out to quantitatively measure / observe
Dependant variables • in toothpaste experiment • There is no difference in the number of cavities in children and teenagers using glow-right and no-teeth toothpaste when brushing daily over a one month period in toothpaste experiment • number of cavities • Other things we could have measured • frequency of brushing • preference
Dependant variables • in menu experiment • There is no difference in user performance (time and error rate) when selecting a single item from a pop-up or a pull down menu of length 3, 6, 9 or 12 items, regardless of the subject’s previous expertise in using a mouse or using the different menu types • time to select an item • selection errors made
Dependant variables • in keyboard experiment • There is no difference in user performance (time and error rate) and preference (5 point likert scale) when typing on two sizes of an alphabetic, qwerty and random on-screen keyboard using a touch-based large screen, a mouse-based monitor, or a stylus-based PDA. Other things we could have measured • time to learn to use it to proficiency
Subject Selection • d) Judiciously select and assign subjects to groups • ways of controlling subject variability • reasonable amount of subjects • random assignment • make different user groups an independent variable • screen for anomalies in subject group • superstars versus poor performers Novice Expert
Controlling bias • e) Control for bias • unbiased instructions • unbiased experimental protocols • prepare scripts ahead of time • unbiased subject selection Now you get to do the pop-up menus. I think you will really like them... I designed them myself!
Statistical analysis • f) Apply statistical methods to data analysis • confidence limits: • the confidence that your conclusion is correct • “the hypothesis that computer experience makes no difference is rejected at the .05 level”means: • a 95% chance that your statement is correct • a 5% chance you are wrong
Interpretation • g) Interpret your results • what you believe the results really mean • their implications to your research • their implications to practitioners • how generalizable they are • limitations and critique
Planning flowchart for experiments Stage 1 Stage 2 Stage 3 Stage 4 Stage 5 Problem Planning Conduct Analysis Interpret- definition research ation feedback research define data interpretation preliminary idea variables reductions testing generalization literature review controls statistics data reporting collection apparatus hypothesis statement of testing problem procedures hypothesis select development subjects experimental design feedback Copied from an early ACM CHI tutorial, but I cannot recall which one
You know now • Controlled experiments strive for lucid and testable hypothesis quantitative measurement measure of confidence in results obtained (statistics) replicability of experiment control of variables and conditions removal of experimenter bias • Experimental design requires careful planning