Planning, Running, and Analyzing Controlled Experiments on the Web
570 likes | 744 Vues
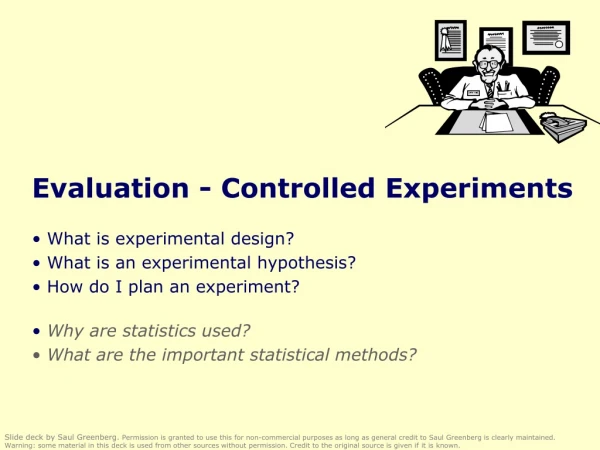
Part 2. Planning, Running, and Analyzing Controlled Experiments on the Web. Roger Longbotham, Mgr Analytics, Experimentation Platform, Microsoft. Slides available at http://exp-platform.com. Planning and Analysis of Online Experiments. What to measure How to compare Treatment to Control

Planning, Running, and Analyzing Controlled Experiments on the Web
E N D
Presentation Transcript
Part 2 Planning, Running, and Analyzing Controlled Experiments on the Web Roger Longbotham, Mgr Analytics, Experimentation Platform, Microsoft Slides available at http://exp-platform.com
Planning and Analysis of Online Experiments • What to measure • How to compare Treatment to Control • How long to run test • Start up options • Good test design • Data validation and cleansing • Before your first experiment • Common errors • MultiVariable Tests
What to Measure • Start with objective • Of the site (content, ecommerce, marketing, help/support,…) • Of the experiment • What can you measure to tell you if you met your objective? • Content site: clicks/user, pageviews/user, time on site • Ecommerce: rev/visitor, units purchased/visitor, cart-adds/visitor • Marketing: referrals/visitor, time on site • Help/support: Pct of users engaged, Pct of users who print, email or download content, time on site
What to Measure • Measures of user behavior • Number of events (clicks, pageviews, scrolls, downloads, etc) • Time (minutes per session, total time on site, time to load page) • Value (revenue, units purchased) • Experimental units • Per user (e.g. clicks per user) • Per session (e.g. minutes per session) • Per user-day (e.g. pageviews per user per day) • Per experiment (e.g. clicks per pageview)
Overall Evaluation Criterion • It is very helpful to have a single metric that summarizes whether the Treatment is successful or not – the Overall Evaluation Criterion, or OEC • Examples: • Content site: OEC could be clicks/user or time on site • Ecommerce: rev/user or lifetime value • Help/support site: Survey responses or user engagement • OEC could also capture monetary value of the Treatment effect, aka ROI (return on investment)
Comparing Treatment to Control • Single Treatment • Two-sample t test works well • Large samples sizes => Normal distribution for means • Calculate 95% Confidence Interval for difference in two means if zero not in the interval conclude Treatment mean different from Control • May have many tests, OEC critical • Multiple Treatments • Multiple applications of two-sample t test • Analysis of Variance
Sample UI for test results Note: Averages for both variants P-values Percent change Significance Confidence Intervals 103 metrics
Comparing Treatment to Control • P-value is the probability of getting a difference farther from zero than observed under assumption of no difference • CI for percent effect must use special formulas • Care must be taken in calculating standard deviations • When randomization is by user, any metric that is not per user must take into account non-independence in calculating standard deviation • We routinely use bootstrapping to estimate standard deviations
Power and Sample Size • The power of a test is the probability of detecting a difference (D) of a given size i.e., it is 1-Prob(Type II error) Power depends on • The size of effect you want to be able to detect, D • Variability of the metric • Number of users in each group (T/C) It is typical to determine the sample size needed to achieve 80% power
Power and Sample Size • Example: Total number of users needed to achieve 80% power, with equal number of users in Treatment and Control and with standard deviation s is
Ramp up • Often good practice is to start with small percent in Treatment and increase when you have confidence Treatment is bug-free • Sample ramp up schedule: • 1% in Treatment for 4 hours • 5% in Treatment for 4 hours Ramp-up period • 20% in Treatment for 4 hours • 50 % in Treatment for 14 days
MultiTreatment Tests • Example: Real Estate widget design • Test five alternatives to the current design • OEC: clicks to links weighted by revenue per click T2 T1 Control T5 T4 T3
Real Estate Widget • The widget that performed the best was the simplest • Revenue increase over control: +9.7% Note Ronny’s example earlier compared the best Treatment to another Treatment, not the Control
Design of Experiments • Triggering • Blocking • Measuring non-test factors • Randomization
Triggering Only allow users into your experiment if they “trigger” the experiment. i.e. a user’s data should only be used in the analysis of the experiment if they saw one of the variants Example: MSN UK Hotmail experiment Control: When user clicks on email hotmail opens in same window Treatment: Open hotmail in separate window Which users do you want to track as part of your experiment?
Blocking non-test Factors • Factor is controlled such that it affects both treatment and control equally, hence not affecting the estimate of the effect • Blocking on a factor is more common than keeping it fixed (keeping it constant throughout the experiment) • Advantages to blocking • Can estimate the effect of the different levels of the factor, e.g. what is the effect on weekends/weekdays • Can make inference to a broader population
Examples of Blocking • Time (time of day, day of week, etc.) Bad test design => run control at 100% M-W then treatment at 100% Th-Sa Always run treatment and control concurrently in online experiments • Content Ex: If content of a site changes during the experiment it must be the same for both Treatment and Control at all times
Design Principle The Treatment and Control groups should be as alike as possible except for application of the treatment • Who is in the experiment • What is done during the experiment • etc. Updates to the site during the test must be applied to all variants in the test
Design Principle Example: One partner was conducting an A/A test (same as an A/B test but no real change is made) What would you expect? Results: Treatment very significant (much more than it should be) Why? Found out another group was using their Treatment group to test something so there really was a difference between T and C
Design Principle • Ex: A site was testing a change to the layout of their page • Content to T and C was not the same for a 7 hour period
Measure non-test Factors Measuring the value of non-test factors allows you to • Delve into why the treatment had the effect it did (e.g. more PVs are correlated with faster load time which explains almost all the effect of the Treatment) • Determine if subpopulations behave the same (e.g. did the Treatment have the same effect for new users as for returning users?)
Randomize Why randomize? So that those factors you can’t control (or don’t know about) don’t bias your results “Randomization is too important to be left to chance” Robert Coveyou, ORNL Unknown Factors
Randomize How to randomize? (online tests) Randomly assign T or C to user (alternately could use user-session, search query, page view or product/SKU) Usually best by user (store UserID in cookie) How persistent is the UID? Ideally user always gets same treatment group Limitations: • Clearing cookies => can change treatment • Different computer/browser => may get different treatment • Can’t allow opt-in or opt-out
Representative Test Make sure users and conditions are as representative of launch environment as possible • Time period: not holiday (unless holiday factor), pre-holiday, complete cycle (day, week) • Users: all users who would see T in the future, not robots, not internal testers, outliers(?) • Not during special events
Robot Detection and Removal • Remove robots (web crawlers, spiders, etc.) from analysis • They can generate many pageviews or clicks in Treatment or Control skewing the results • Remove robots with known identifiers (found in the user agent) • Develop heuristics to identify robots with many clicks or pageviews in short period of time • Other patterns may be used to identify robots as well, such as very regular activity
Effect of Robots on A/A Experiment • Each hour represents clicks from thousands of users • The “spikes” can be traced to single “users” (robots)
Data Validation checks • Carry out checks to make sure data is not affected by some unknown factor • Check that percentage of users in each variant is not different from planned (statistical test) • Check that number of users in the experiment is approximately what was expected (and doesn’t change too much during experiment) • Check that the Treatment effect does not change too much during experiment • Check that means for primary metrics do not change unexpectedly • Always plot the data over time
Before Your First Experiment • Conduct logging audit • Compare data collected for experiment to system of record • Should have approximately same number of users, clicks, pageviews, orders, etc. • Conduct A/A test • Split users into two groups that get same experience • Should have about 5% of tests significant • p-values should have U(0,1) distribution • No p-values should be extremely small (say <.001)
Common Errors • Not conducting logging or A/A tests • Find caching issues, UID reassignment • Not keeping all factors constant or blocking • Content changes to site • Redirect for Treatment but not for Control • Sample size too small • Not measuring correct metric for OEC • Measure clicks to buy button (instead of revenue) • Clicks to download button (instead of completed downloads)
MultiVariable Tests (MVTs) • Several factors/variables, each of which has two or more levels (C/T1/T2/…) • Main effects:Comparison of Treatments to Control for each variable (i.e. compare means for T and C same as before) • Interactions: Determine if combinations of variables have different effect than adding main effects
Example: MultiVariable Test on MSN HP Factors/variables F1: Size of Right col ad C = current size T1 = 10% larger T2 = 10% smaller F1 F2: MSNBC news stories C = Top international T = Specific to country ID’d F2 F3: Sports/Money placement C = Sports above Money T = Money above Sports OEC: Clicks per User Other metrics: PVs, CTR F3 (This is for illustration purposes only, it does not reflect any previous or planned test on MSN HP)
Multivariable Tests Advantages: • Can test many things at once, accelerating innovation • Can estimate interactions between factors Disadvantages • Some combinations of factors may give negative customer experience • Analysis and interpretation is more difficult • May take longer to set up test
Designs for Multivariable Tests On-line experiments can simply run overlapping, concurrent, independently randomized experiments Example: Test 7 factors each at 2 levels Set up 7 separate experiments to run at the same time with the same users. Get all 128 combinations in the results. Advantages: • Easier to implement • Can turn off one experiment if negative • Get all interactions
Analysis for Interactions Procedure for analyzing an MVT for interactions • Since there are potentially a vary large number of interactions among the variables being tested, restrict the ones you will look at to a few you suspect may be present. (If 7 factors, 21 two-factor interactions, 35 three-factor interactions, etc.) • Conduct the test to determine if the interaction between two factors is present or not • If interaction is not significant, stop! If the interaction IS significant, look at the graphical output to interpret.
Analysis for Interactions Example: Factors from MSN HP illustration Hypothesis tests for interactions similar to main effects (details omitted) F3 Sports/Money placement C = same order every day T = Sports higher on wkends and Money higher wkdays F2: MSNBC news stories C = Top international T = Specific to country ID’d
Example: MVT Experiment on MSN HP Factors/variables F2: MSNBC news stories C = Top international T = Specific to country ID’d F3: Sports/Money placement C = Sports above Money T = Money above Sports F2 OEC: Clicks per User Other metrics: PVs, CTR F3 (This is for illustration purposes only, it does not reflect any previous or planned test on MSN HP)
Graphical Analysis of Interactions • If hypothesis test for interaction is not significant • Assume no interaction present • Interaction graph would show lines approximately parallel • If interaction is statistically significant • Plot interaction to interpret
Graphical Analysis of Interactions Case 1: No Interaction (parallel lines) Data Table Main Effects Results
Graphical Analysis of Interactions • When interaction is statistically significant Two types of interactions: • Synergistic – when the presence of both is more than the sum of the individual treatments • Antagonistic – when the presence of both is less than the sum of the individuals
Microsoft Confidential Graphical Analysis of Interactions Case 2: Synergistic Interaction Data Table Main Effects Results
Microsoft Confidential Graphical Analysis of Interactions Case 3: Antagonistic Interaction Data Table Main Effects Results
Case Study: EVS Experiment Current Model • Pre-roll ad played before first content stream • Don’t disturb users by playing ad when a content stream is playing • Ad stream played before the content stream when content streams played for more than 180 seconds continuously
Case Study: EVS Experiment (cont.) Business Questions • Could removing pro-roll ad stream attract more returning users? • Could shortening the minimum time between two ad streams attract more returning users? • Would ad stream gain from returning users offset the loss of not playing pre-roll or playing ad less frequently?
Case Study: EVS Experiment (cont.) Experiment Design • Factor 1: Play (Control) or Do Not Play pre-roll • Factor 2: 5 levels of minimum time between two ad streams • 90, 120, 180 (Control), 300, 900 seconds • Users who received treatments in two week observation window continued to receive treatments and were monitored for the following six weeks for their return rate
Case Study: EVS Experiment (cont.) Assuming the Overall Evaluation Criterion (OEC) is Percent of Returning Users Vote for result on Factor 1: • Playing pre-roll is statistically significantly better • Flat (no statistical difference) • Playing pre-roll is statistically significantly worse
Case Study: EVS Experiment (cont.) Vote for result on Factor 2: which of the following attract statistically significantly more returning users • 90 seconds • 120 seconds • 180 seconds • 300 seconds • 900 seconds • Flat (no difference)
EVS Experiment: Interaction between Factors 1 and 2 Content First Ads First