Download
1 / 43
440 likes | 720 Vues
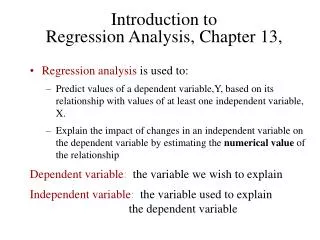
Learn the 5 steps of regression analysis to analyze and interpret regression results. Explore hypothesis testing, estimation, and evaluation for meaningful insights. Apply linear and multivariate regression concepts with practical examples.

E N D
Goals of this chapter • To understand regression results well enough to determine whether they support a hypothesis • To perform simple regressions to test your own hypothesis
Steps in regression analysis • A regression analysis can be broken down into 5 steps. • Step 1: state the hypothesis. • Step 2: test the hypothesis (estimate the relationship). • Step 3: interpret the test results. This step would enable us to answer the following questions,
Steps in regression analysis (cont’d) • To what extent do the estimates for the coefficients conform to the alternative (maintained) hypothesis identified in the initial step. • Are the estimates statistically significant? • Are they (the estimates) economically significant? • Are they plausible for the real world, consistent with economic theory? • Does the regression model give “a good fit”?
Steps in regression analysis (cont’d) • Step 4: check for and correct common problems of regression analysis. • Step 5: evaluate the test results. • Let us explain each step one by one.
Step 1: state the hypothesis • Suppose that we think that stock market wealth (SMW) (the increase in equity prices) has a positive effect on spending (C). • C = f(SMW) where f’>0. • C is the dependent variable. It is the concept we are trying to explain. SMW is the independent or the explanatory variable which we use to explain C (SMW causes C).
Step 1: state the hypothesis (cont’d) • We generally assume that there is a linear relationship between the dependent and independent variables. This assumption has 2 bases: (i) nonlinear estimation is extremely difficult to perform, (ii) even though a relationship is nonlinear we can make a linear approximation for that nonlinear relationship.
Step 1: state the hypothesis (cont’d) • Let us turn to our example. If the relationship between C and SMW is linear, • C = a + b(SMW) • “b” shows the effect of the change in SMW on C assuming that everything else is constant at the same time. “b” is the slope of the equation and “a” is the vertical intercept of this linear function (the point where the function hits the vertical axis). Finally, this is a bivariate regression, because we have only 2 variables.
Step 1: state the hypothesis (cont’d) • There may be other variables affecting C. So, we can take additional variables into account. • C = a + b1(SMW) + b2(Y) + b3(OW) where Y is income and OW indicates other forms of wealth. These kind of regressions are called as multiple (multivariate) regressions, since the dependent variable is affected by a group of explanatory variables.
Step 1: state the hypothesis (cont’d) • In this particular example, we hypothesized that C is affected positively by SMW (if SMW increases, C will increase in return as well). So, “b” would be positive.
Step 2: test the hypothesis(estimation) • The estimation would be made by using the following regression, • C = a + b1(SMW) + b2(Y) + b3(OW) + e • “e” represents the error term. Estimation is what regression is all about. We will make certain assumptions about “e” which would enable us to estimate the underlying relationship. Violation of these assumptions will require us to use different estimation techniques.
Step 2: test the hypothesis (cont’d) • The main purpose of regression is to generate estimates of the relationship between the dependent variable (C) and each of the explanatory variables (SMW, Y, OW). These estimates are called estimated parameters (estimated coefficients). A variety of computer programs are available for this task.
Step 2: test the hypothesis (cont’d) • Let us give a real example. Consider that the following regression is estimated. We’ll learn how to interpret this in the next section.
Step 3: interpretation of the results • This is the most important part of the regression analysis. To understand whether the test results (empirical results) are consistent with our maintained hypothesis we should evaluate the regression results. Remember that we test the null that there is no relationship. Thus the hypothesis we make is the opposite of the theoretical prediction.
Step 3: interpretation (cont’d) • Do we expect a (+) or a (-) relationship between the dependent and independent variables? Do we have any expectation about the magnitudes of the coefficients we estimated. Let us give an example from the theory.
Step 3: interpretation (cont’d)(start with your theoretical predictions) • Classical theory suggests that aggregate demand could have no effect on the levels of employment and output in the economy. In other words, inflation rate (Pi) is identical to the growth rate of the money supply (%∆Ms). The equation would be as follows: • Pi = a + b (%∆Ms) • Shortly, the theory suggests that a=0 and b=+1.
Step 3 (cont’d)(to what extent do the coeff. estimates conform to your theory?) • Consider the empirical example for the quantity theory of money explained in the previous slide.
Step 3: interpretation (cont’d)(start with your theoretical predictions) • We have learnt that t stat. equals to:
Step 3: interpretation (cont’d)(start with your theoretical predictions) • In this formula, “b” takes the role of “x” and “mu” is the true value of the coeff. The null is b=0 while the maintained hypothesis (or the theoretical prediction) is b≠0. Substituting the null in the t equation. • t = (b - 0)/[s/(square root n)] , • t = b/SE, where b is the estimated coeff. and SE is the standard error of this estimated relationship.
Step 3: interpretation (cont’d)(start with your theoretical predictions) • If estimated t value > critical t value for the desired significance level, we reject the null and conclude that b≠0 (b is statistically significant). • We have a “p value” as well to evaluate the hypotheses. If the p value is smaller than the level of significance (alpha) (if p<α), one can reject the null and conclude that the coeff. estimate is statistically significant.
Step 3: interpretation (cont’d)(start with your theoretical predictions) • How about the magnitudes? It is very unlikely that the estimates will exactly match the predictions of the theory. The question is how close is close enough? To understand whether the estimated coeff. is different from the theoretical predictions we can perform a test: a t test. The null is that the two are equal. Let us now substitute the null into the t statistics formula,
Step 3: interpretation (cont’d)(start with your theoretical predictions)
Step 3: interpretation (cont’d)(start with your theoretical predictions) • “b hat” is the estimated coeff. • “b” is the predicted coeff. • SE is the standard error of the estimated coeff. • In our example, (0.91-1)/2.6=-1.6. Since this estimated t value is less than the critical t of 2.0 (-1.6<2.0), we can say that the estimated coeff is not statistically different from the theoretical coeff. (do not reject the null).
Step 3: interpretation (cont’d)(statistical vs. economic significance) • McCloskey argues that statistical significance is often confused with the economic (scientific) significance. If the coeff. of the independent variable is extremely small then it may not be a very important determinant for the dependent variable even though it is statistically significant (magnitude is important!).
Step 3: interpretation (cont’d)(how “good a fit” is the regression model?) • Regression analysis selects parameter estimates to sketch a regression line that best fits the data. To evalute whether this goal is achieved we use R squared (R2) and F statistic. R squared is the estimate of the proportion of the variation in the dependent variable explained by the independent variables. It is favorable to have high values for R2.
Step 3: interpretation (cont’d)(how “good a fit” is the regression model?) • However, relying on the R2 may be misleading due to the fact that R2 increases as you use additional independent variables in the regression even though they are irrelevant(!) (because of the formulation of R2). To correct this problem use “adjusted R2” instead of R2.
Step 3: interpretation (cont’d)(how “good a fit” is the regression model?) • The F statistic tests the hypothesis that ALL estimated coefficients are jointly equal to zero. If the estimated F stat. > critical F value, then we can reject the null and conclude that ALL coefficients are statistically significant. As you see, the procedure is just like the one we use while performing the t test. In such a case we can claim that the model as a whole is valid.
Step 4: check for and correct problems of regression analysis • The validity of the OLS regression estimates depends on the existence of some technical assumptions. If they do not exist we would face 5 problems which we will discuss in the subsequent sections.
Step 4 (cont’d) (problem 1: autocorrelation) • The OLS estimation methodology is based on the assumption that the relationship between the dependent and explanatory variables is linear. A further assumption is that the error in each observation is independent of the error in all the others. In other words, if one error is positive, the next error must be negative. If this is not the case...
Step 4 (cont’d) (problem 1: autocorrelation) • ...namely, if a positive (negative) error is followed by another positive (negative) error, then we can claim that the errors are auto (serially) correlated. Autocorrelation means that the errors are dependent on or correlated with each other (error in one period is correlated with the error in the next period).
Step 4 (cont’d) (problem 1: autocorrelation) • Why do we have autocorrelation? • One possibility is that we have omitted a relevant explanatory variable. This is a specification error. The model is incorrect. In such cases, it would be helpful to add the missing variable to the estimation. Whatever the cause, 1st order autocorrelation is modeled as follows:
Step 4 (cont’d) (problem 1: autocorrelation) • et= p[e(t-1)] + ut • “p” is the value that indicates the extent to which the error in one period affects the error in the next period. • The easiest way to check for 1st order autocorr. is to use Durbin-Watson (DW) statistic.
Step 4 (cont’d) (problem 2: heteroskedasticity) • Another assumption of the OLS estimation technique is that the errors have constant variance though they are independent from one another. This implies that large values of the dependent variable are not likely to have larger errors compared to the smaller values of the dependent variable. However there may be economic reasons why it fails to occur.
Step 4 (cont’d) (problem 2: heteroskedasticity) • Think for a second that you are investigating the relationship between expenditures and income. It would not be unlikely for you to discover that errors in spending increases as income does. In such a case you cannot draw correct inferences about the statistical significance of the parameter estimates (which was also the case when we have autocorrelation).
Step 4 (cont’d) (problem 2: heteroskedasticity) • How can we understand the problem? • The most common way is to plot the errors against each explanatory variable. If the errors remain the same as the explanatory variable increases, then we can claim that we have homoskedastic errors. If the errors increase or decrease in magnitude as the explanatory variable increases, this time we have heteroskedastic errors.
Step 4 (cont’d) (problem 3: simultaneous equation bias) • The OLS methodology assumes that ALL the explanatory variables are independent or exogenous. Which means that they are determined outside the model estimated. Let us give an example.
Step 4 (cont’d) (problem 3: simultaneous equation bias) • Assume that Ali is a plumber. We want to investigate his demand for pizzas as a function of his income. His demand for pizza depends on his income that he earns by working as a plumber. So, Ali’s income is independent of his purchases of pizza, since he is not managing a pizza restaurant . His income is exogenous and his demand for pizzas can be estimated easily as a function of his income.
Step 4 (cont’d) (problem 3: simultaneous equation bias) • What if Ali is a manager of a pizza restaurant and works on commissions? (He is in pizza business!) • In this case, his income would be affected by the number of pizzas he buys (consumes). In other words his income is endogenous. Ali’s income is also a function of his spending on pizza. So, an increase in his income leads to an increase in his spending on pizzas which leads to an increase in his income and another increase in his spending.
Step 4 (cont’d) (problem 3: simultaneous equation bias) • So, when the explanatory variables (Ali’s income) are determined by the dependent variable (Ali’s pizza purchases) (when they are endogenous), the parameter estimates will be biased. This is called the simultaneous equation bias.
Step 4 (cont’d) (problem 4: specification error) • There are 2 aspects to consider during the specification of the model: (i) the model must include correct explanatory variables, (ii) the model must have the appropriate functional form. In other words, to use OLS the relationship that we try to estimate should be linear, or approximetaly linear.
Step 4 (cont’d) (problem 5: multicollinearity) • We have the problem of multicollinearity when the 2 or more explanatory variables are linearly correlated. To check for this problem, we may take a look at the correlation matrix for the explanatory variables. A common rule of thumb is that if the correlation coeff. between the 2 explanatory variables is greater than 0.80, then we have the problem!
Step 5: evaluate the test results • What do the findings say? This is the final question we should deal with after the fulfillment of the first four steps. • Remember that if an estimated coeff. is not statistically significant, then it should be treated as zero. Besides, some coefficients will be economically significant and some will not. The overall model may give a good fit, or it may not. Most of the time nothing would happen the way you want it to when it comes to regression analysis! So, we have a very important issue to consider.
Step 5: evaluate the test results(cont’d) • Did the key coefficients match? Do the estimates of the coefficients for the most important explanatory variables satisfy your economic and statistical expectations? If yes, then you have some evidence that supports your hypothesis. Evaluation of the findings is more like an art than science. It is not just a simple calculation.